|

USD/CHF technical analysis: Greenback under pressure below 0.9700 as sellers challenge June lows

  • CHF is up as Wall Street indices start the week in the red. 
  • The level to beat for bears are at the 0.9675 and 0.9660 levels.
 

USD/CHF daily chart

 
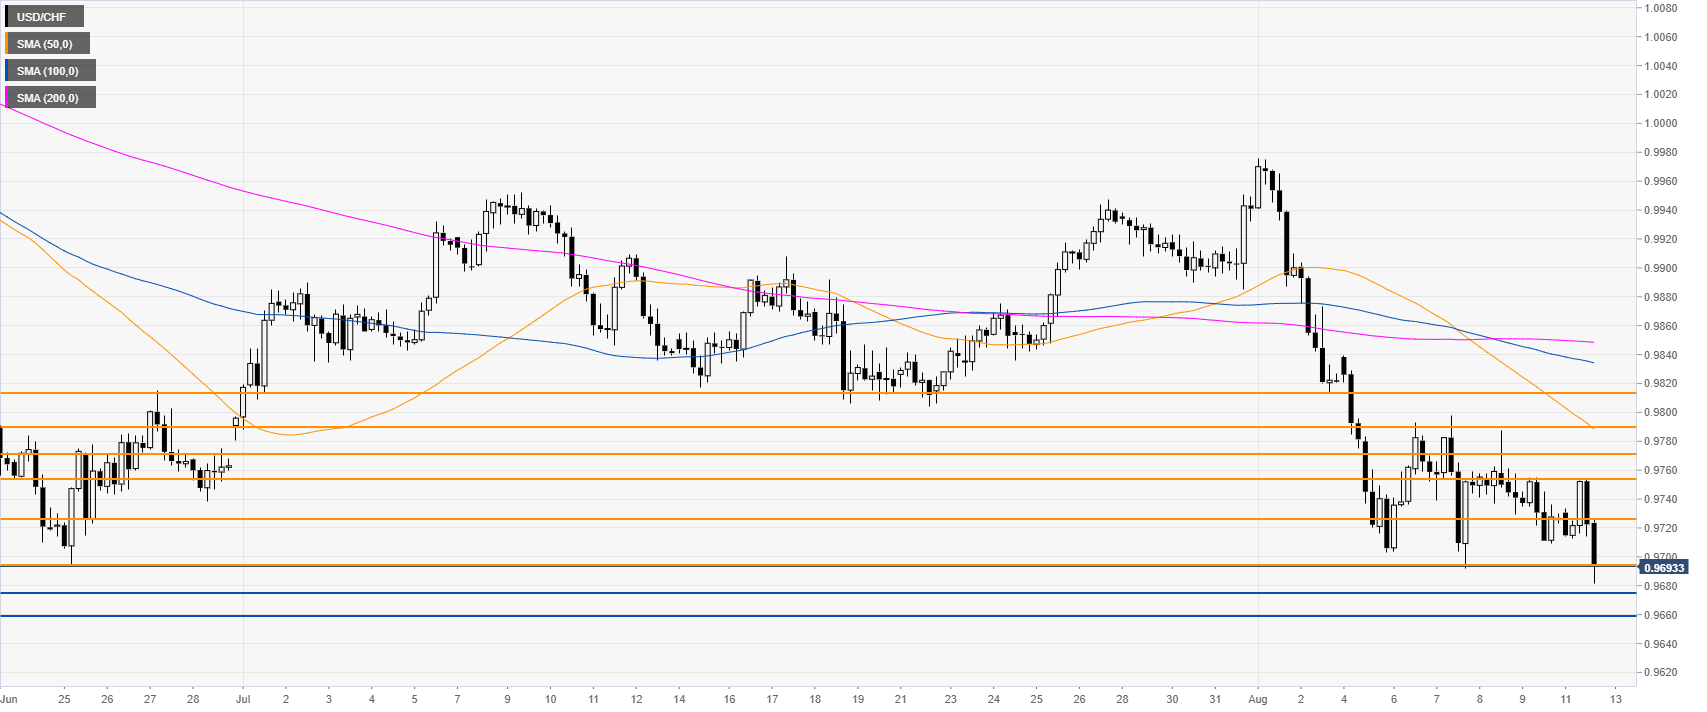
USD/CHF is trading near 2-month lows below the main daily simple moving averages (DSMAs). US equity markets are starting the week on the back foot, driving demand for safe-haven currencies such as the Swiss franc.
 

USD/CHF 4-hour chart

 
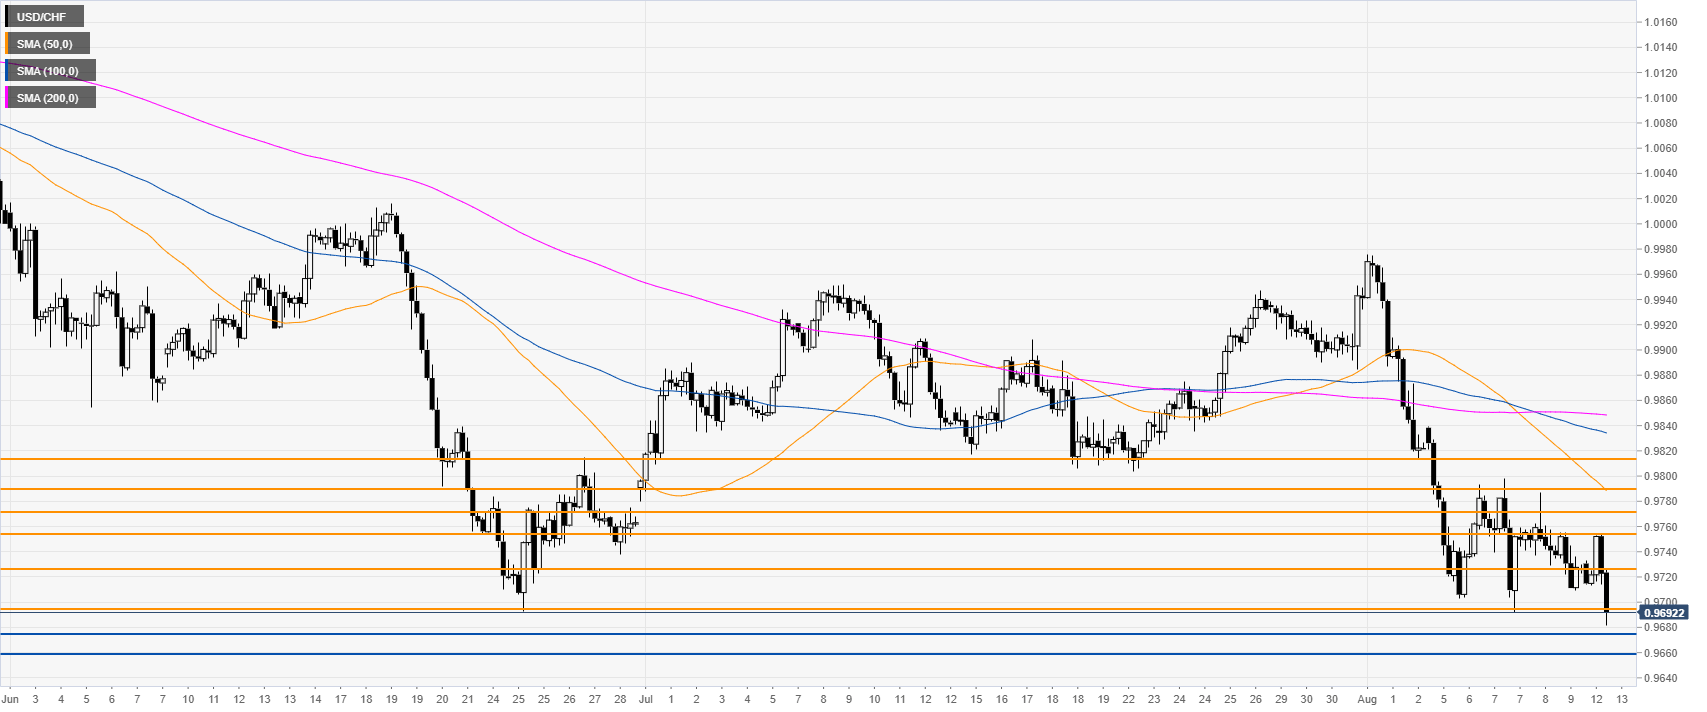
USD/CHF is creeping lower while trading below its main SMAs. Bears want to reach 0.9675 and 0.9660 on the way down, according to the Technical Confluences Indicator.
  

USD/CHF 30-minute chart


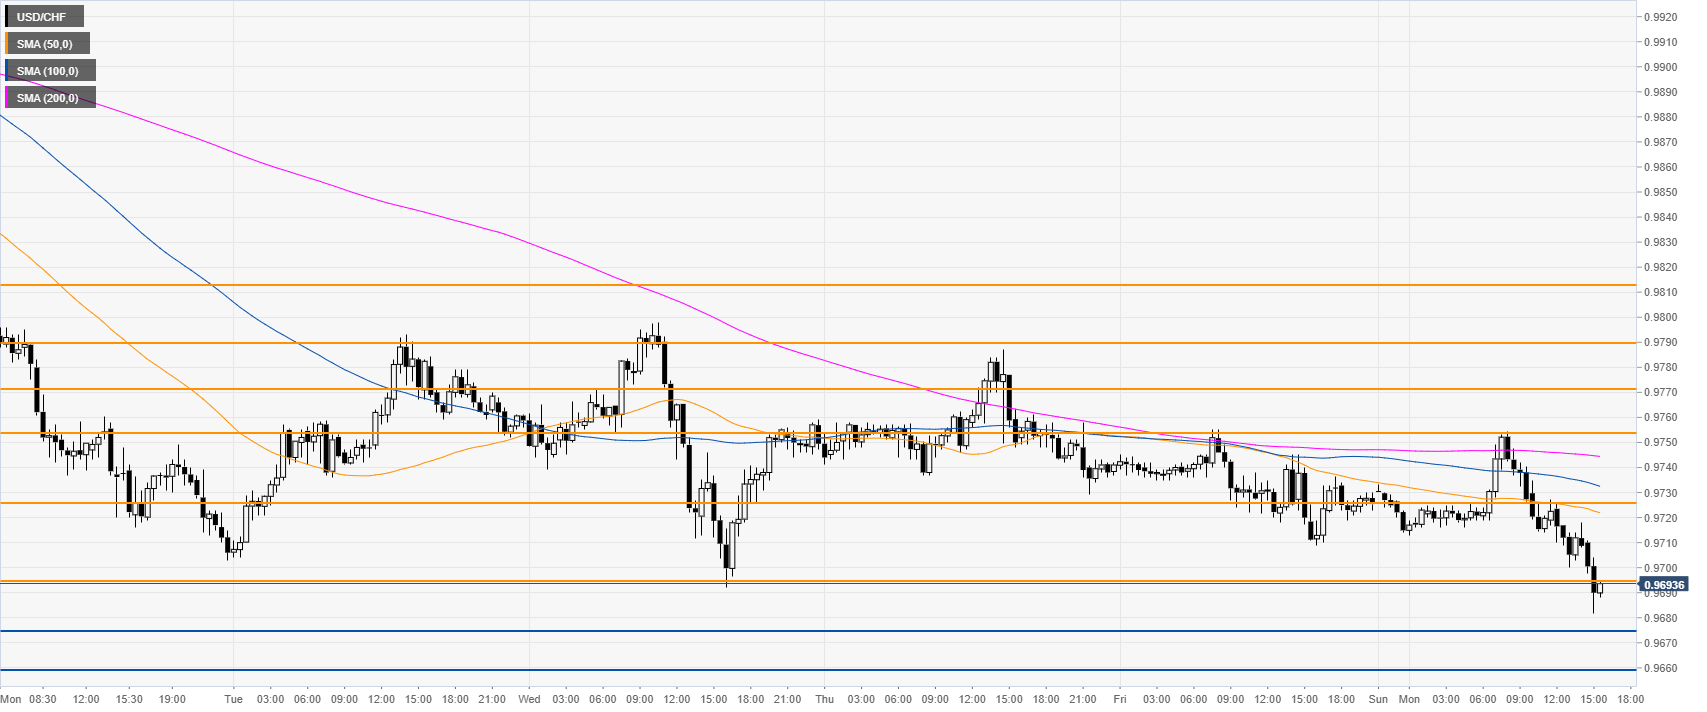
USD/CHF is trading below its main SMAs, suggesting bearish pressure in the near term. Immediate resistances are near 0.9694 and 0.9726, according to the Technical Confluences Indicator. 
 

Additional key levels

USD/CHF

Overview
Today last price0.969
Today Daily Change-0.0035
Today Daily Change %-0.36
Today daily open0.9725
 
Trends
Daily SMA200.984
Daily SMA500.9865
Daily SMA1000.9973
Daily SMA2000.997
Levels
Previous Daily High0.9758
Previous Daily Low0.9709
Previous Weekly High0.9839
Previous Weekly Low0.9692
Previous Monthly High0.9952
Previous Monthly Low0.978
Daily Fibonacci 38.2%0.9728
Daily Fibonacci 61.8%0.9739
Daily Pivot Point S10.9704
Daily Pivot Point S20.9682
Daily Pivot Point S30.9655
Daily Pivot Point R10.9753
Daily Pivot Point R20.978
Daily Pivot Point R30.9802

Author

Flavio Tosti

Flavio Tosti

Independent Analyst


More from Flavio Tosti

Share:

Editor's Picks

GBP/USD: Daily gains remain capped by 1.3650

GBP/USD leaves behind Monday’s pessimism and advances marginally on Tuesday. Cable’s humble gains, however, appear to have met quite a decent resistance in the 1.3650 zone for now, in a context of a slight selling pressure hovering around the Greenback.

EUR/USD struggles to regain pace; gyrates around 1.1670

EUR/USD clinches humble gains around 1.1670 following Tuesday’s close on Wall Street. Indeed, marginal losses in the US Dollar encourages spot to set aside two dauly pullbacks in a row and maintain the 1.1700 barrier on the cross-hairs for now. Moving forward, US inflation tracked by the PCE and another revision of Q2 GDP data should keep investors entertained on Wednesday.

Gold struggles near $4,650 ahead of US PCE inflation data

Gold struggles around $4,650 early Wednesday after the previous day's two-way swings as traders await the US PCE data for cues about the Fed's interest rate path. The outlook could drive the US Dollar and the non-yielding bullion. Meanwhile, renewed hopes for a US-Iran peace deal, weak Oil prices, sliding US bond yields and diminishing odds of an immediate tightening by the Fed undermine the USD, which could likely limit Gold's downside.

Bitcoin posts strongest weekly gain since November 2024 as market activity surges
Bitcoin (BTC) has posted its strongest one-week gain since the November 2024 US presidential election, climbing 23% over the past week as spot market activity and institutional demand returned sharply, according to a Tuesday report from K33. The rally pushed Bitcoin from around $63,000 to over $80,000 by late Monday.
America’s self‑inflicted trade wound
I’m conflicted about the trade war that the U.S. has started with Canada. Let’s be clear: any representation that Canada has been taking unfair advantage of the U.S. or that they have been treating us badly for years is a bogus characterization. In reality, the shoe is on the other foot. It’s the U.S. that has been behaving badly.
Canada hits US goods with tariffs; The rate market sees a problem
On September 8, Canada begins charging its own importers 15%, 25% and 50% on roughly 700 lines of American goods. The measure is billed as dollar for dollar, and on the arithmetic of covered trade it is. What it is not is a tax on the United States.