USD/CHF Technical Analysis: Greenback spiking up to 0.9920 level against CHF
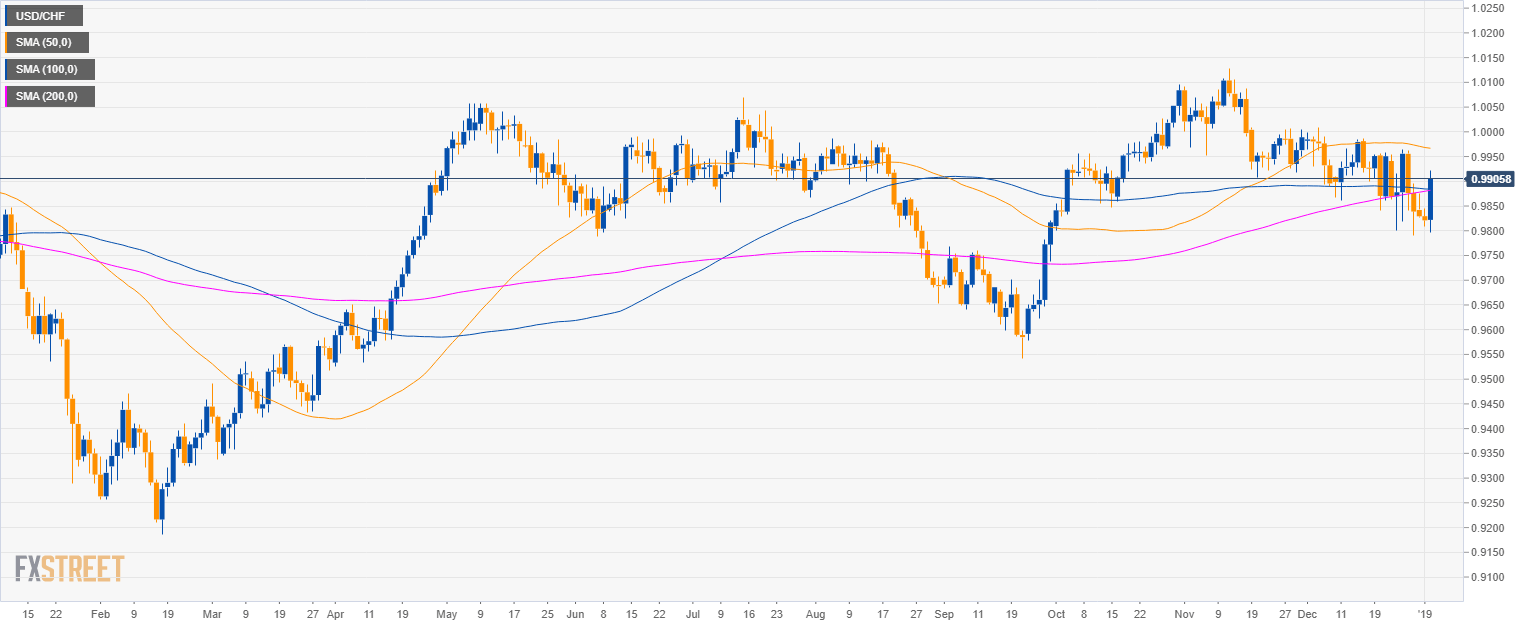
USD/CHF daily chart
- USD/CHF is trading in a sideways trend above the 100 and 200-period simple moving average (SMAs).
- USD/CHF is testing the 0.9900 level.
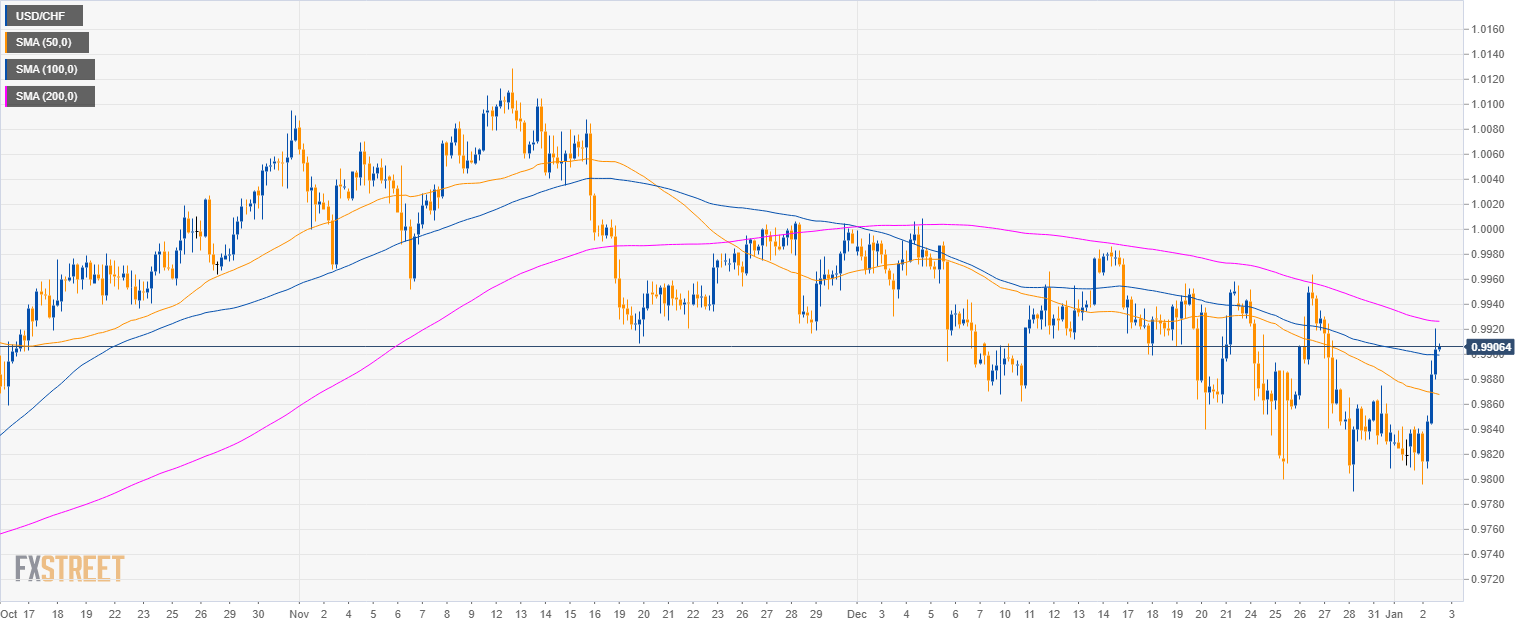
USD/CHF 4-hour chart
- USD/CHF is having a spike up in a bear channel.
- The market is testing the 200 SMA.
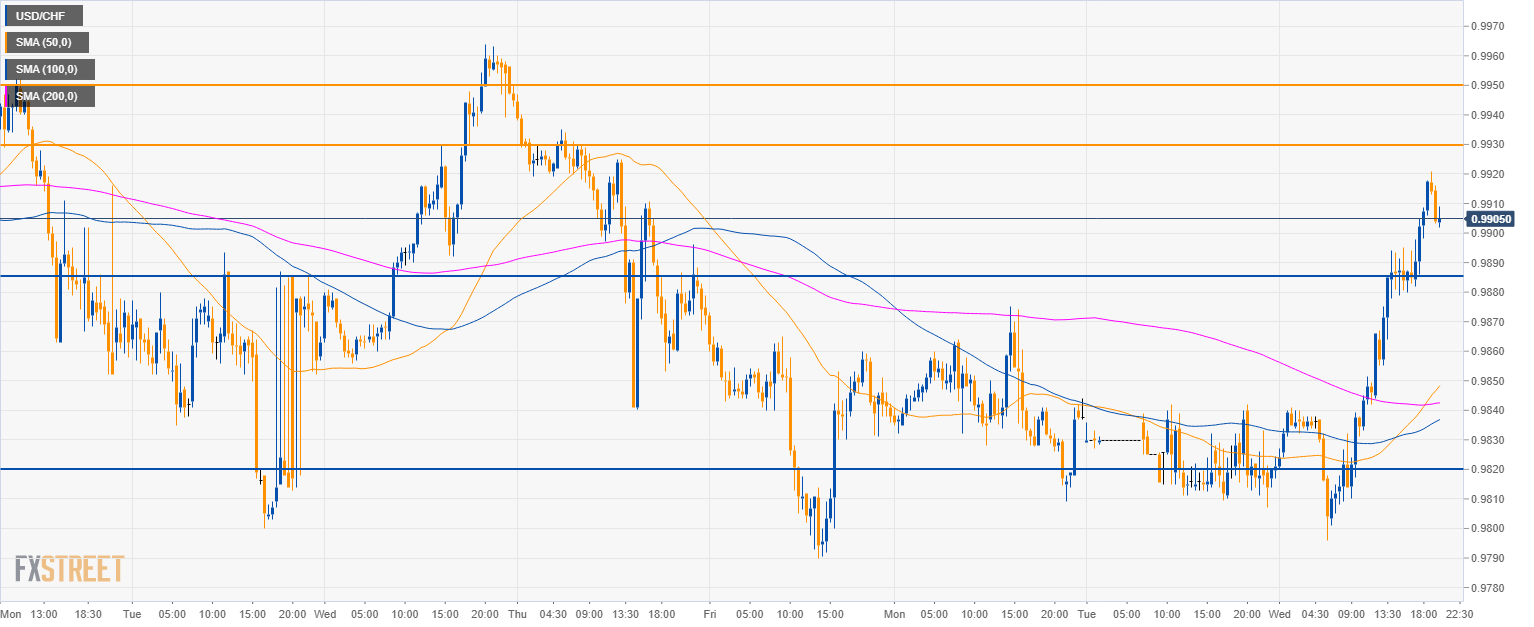
USD/CHF 30-minute chart
- USD/CHF broke above the 50, 100 and 200 SMAs.
- A sustained break above 0.9930 can lead to a bullish continuation to the 0.9950 level.
- On the flip side, a bearish break below 0.9885 can lead to a pullback down to the 0.9820 level.
Additional key levels:
USD/CHF
Overview:
Today Last Price: 0.9908
Today Daily change: 87 pips
Today Daily change %: 0.886%
Today Daily Open: 0.9821
Trends:
Previous Daily SMA20: 0.9909
Previous Daily SMA50: 0.9968
Previous Daily SMA100: 0.9885
Previous Daily SMA200: 0.9877
Levels:
Previous Daily High: 0.9844
Previous Daily Low: 0.9809
Previous Weekly High: 0.9964
Previous Weekly Low: 0.979
Previous Monthly High: 1.0009
Previous Monthly Low: 0.979
Previous Daily Fibonacci 38.2%: 0.9822
Previous Daily Fibonacci 61.8%: 0.9831
Previous Daily Pivot Point S1: 0.9805
Previous Daily Pivot Point S2: 0.979
Previous Daily Pivot Point S3: 0.977
Previous Daily Pivot Point R1: 0.984
Previous Daily Pivot Point R2: 0.986
Previous Daily Pivot Point R3: 0.9875
Author

Flavio Tosti
Independent Analyst


