|

USD/CHF technical analysis: Greenback hits fresh October lows against the Swiss Franc

  • USD/CHF remains under heavy pressure after the London close. 
  • The level to beat for bears is the 0.9871 level. 
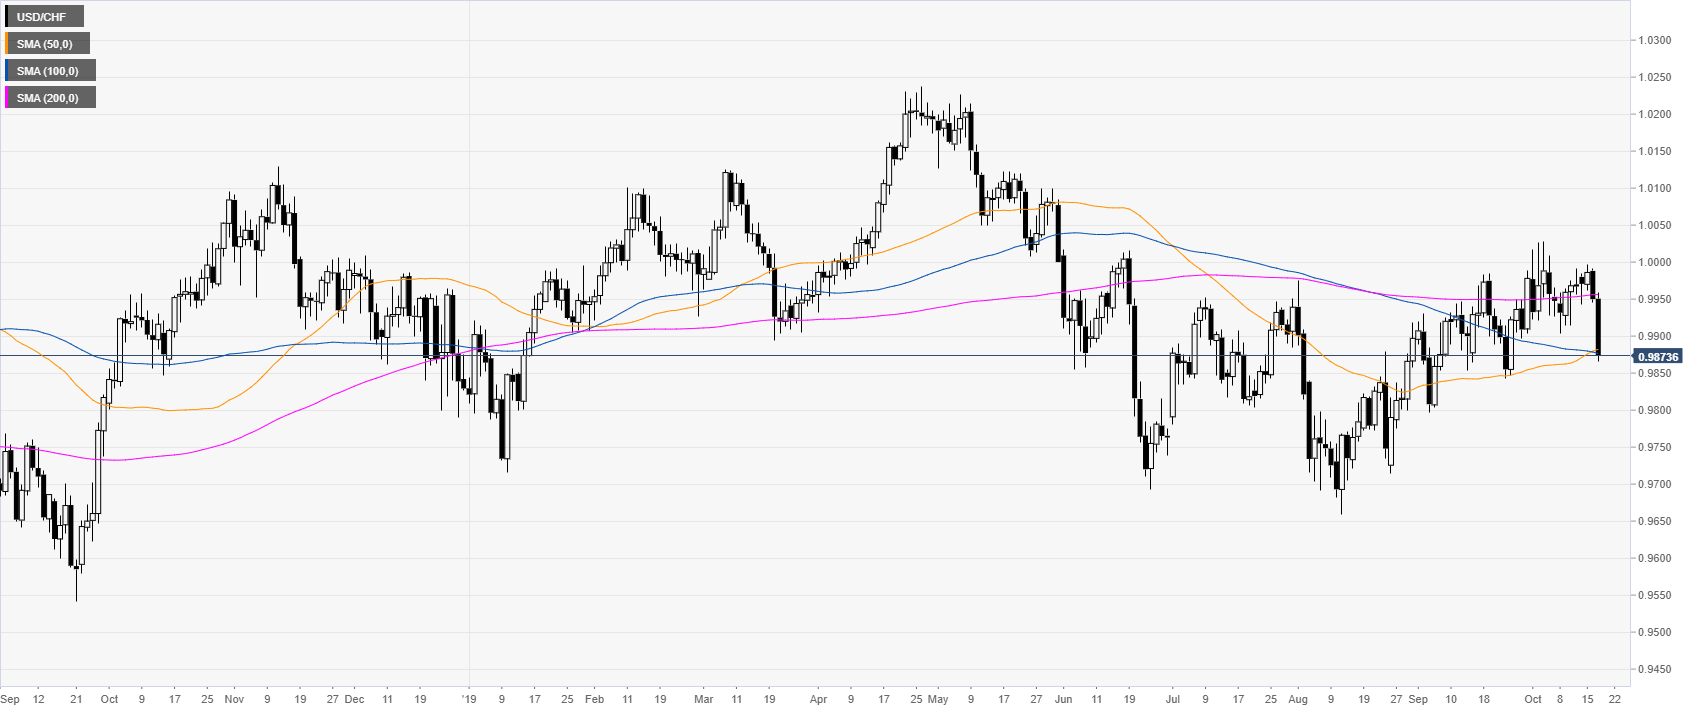
 

USD/CHF daily chart


On the daily chart, USD/CHF is trading in a sideways trend, now challenging the 50 and 100-day simple moving averages (DSMAs) below the 0.9900 handle. 

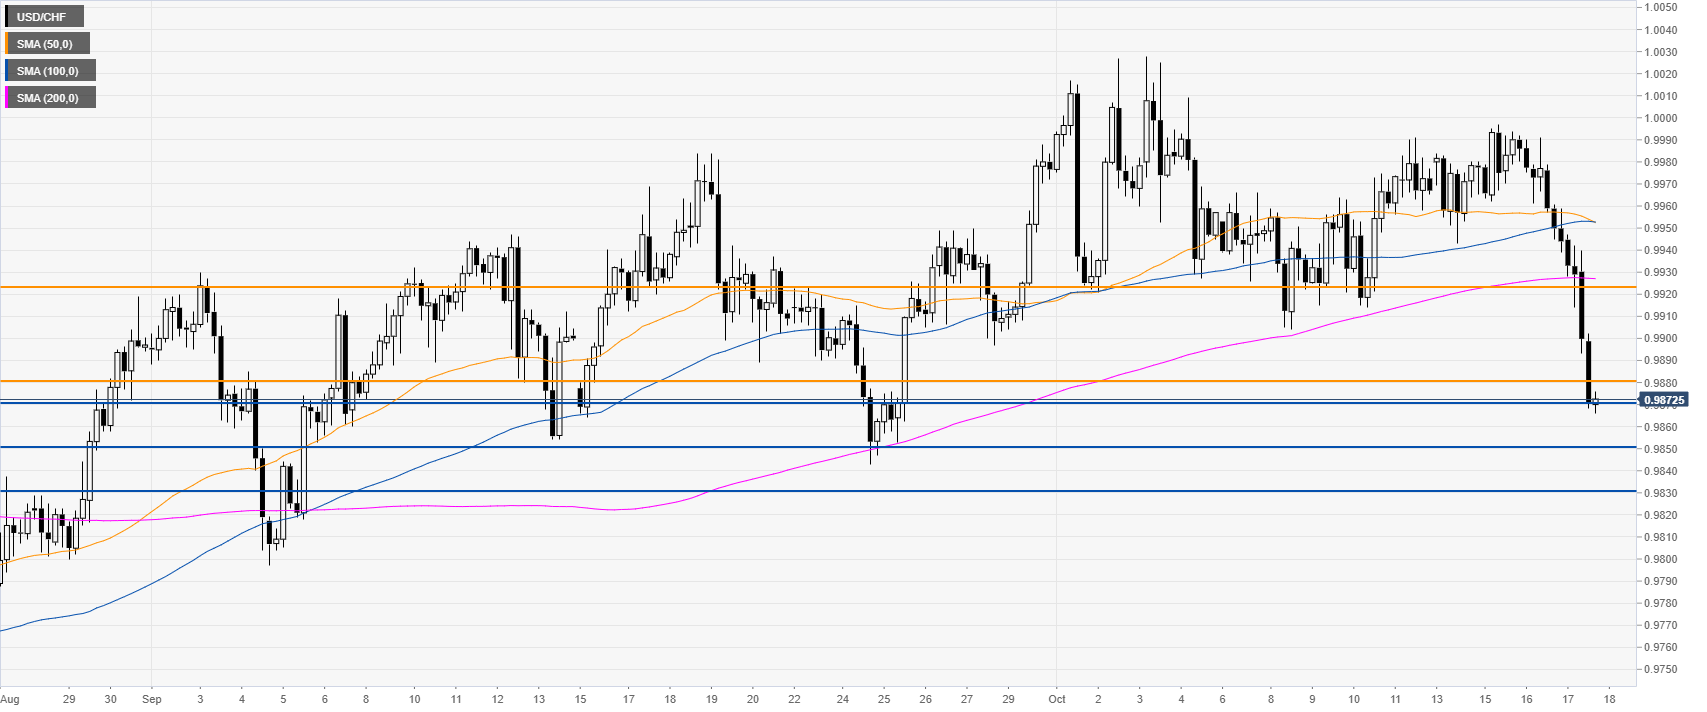
USD/CHF four-hour chart


USD/CHF is under bearish pressure below the main SMAs as the market is trading at its lowest point since late September. A continuation of the bear move below the 0.9871 support can lead to an acceleration towards 0.9850 and 0.9830 price levels, according to the Technical Confluences Indicator

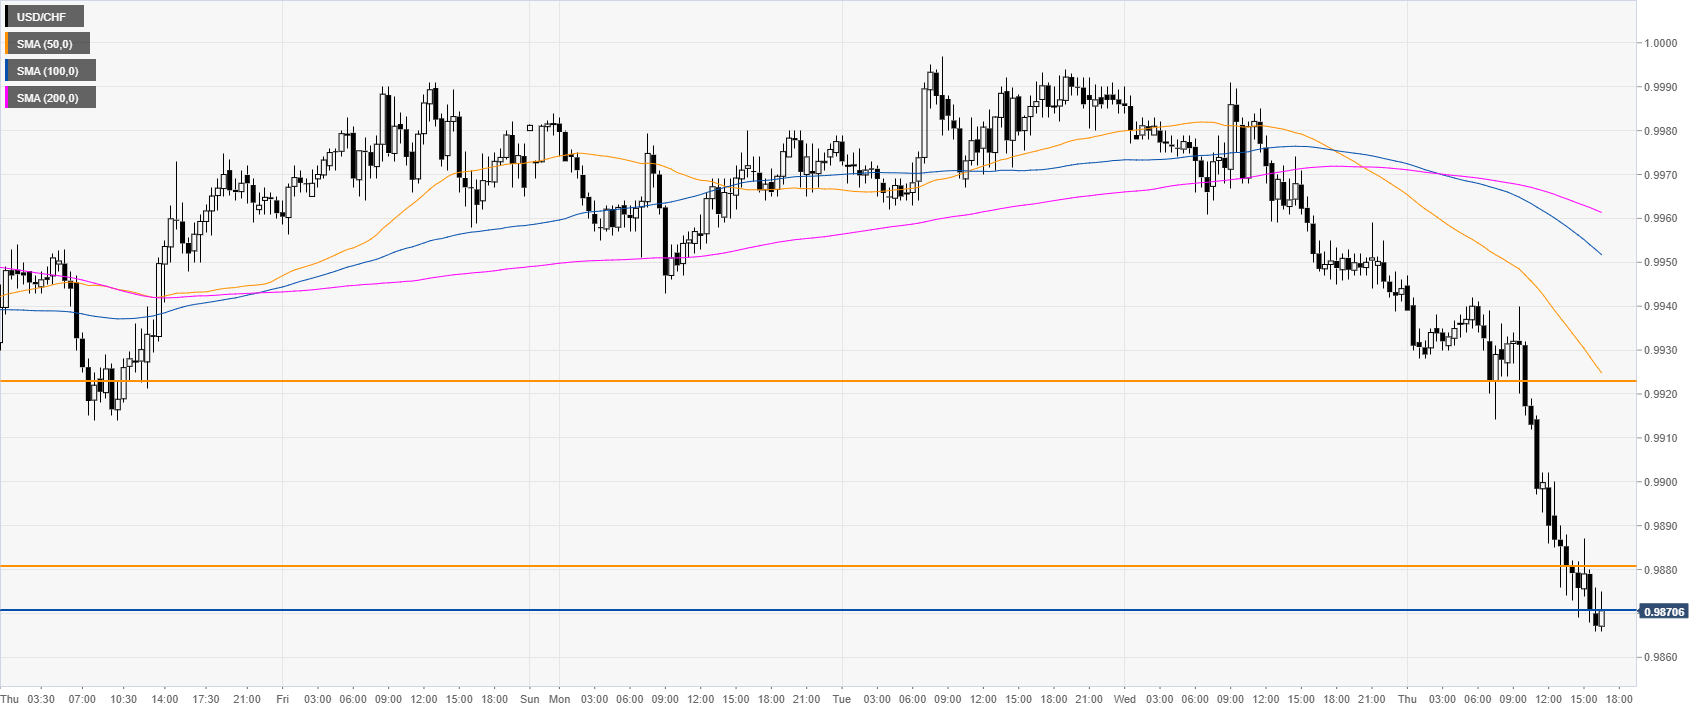
USD/CHF 30-minute chart


USD/CHF is trading below its main SMAs, suggesting a bearish bias in the near term. Resistances can be seen at the 0.9881 level and 0.9922, according to the Technical Confluences Indicator. 
 

Additional key levels

USD/CHF

Overview
Today last price0.9873
Today Daily Change-0.0077
Today Daily Change %-0.77
Today daily open0.995
 
Trends
Daily SMA200.9943
Daily SMA500.988
Daily SMA1000.9879
Daily SMA2000.9956
 
Levels
Previous Daily High0.9992
Previous Daily Low0.9945
Previous Weekly High0.9991
Previous Weekly Low0.9904
Previous Monthly High0.9988
Previous Monthly Low0.9797
Daily Fibonacci 38.2%0.9963
Daily Fibonacci 61.8%0.9974
Daily Pivot Point S10.9933
Daily Pivot Point S20.9915
Daily Pivot Point S30.9886
Daily Pivot Point R10.998
Daily Pivot Point R21.0009
Daily Pivot Point R31.0027

Author

Flavio Tosti

Flavio Tosti

Independent Analyst


More from Flavio Tosti
Share:

Markets move fast. We move first.

Orange Juice Newsletter brings you expert driven insights - not headlines. Every day on your inbox.

By subscribing you agree to our Terms and conditions.

Editor's Picks

EUR/USD extends gains toward 1.1700, eyes US PCE for fresh impetus

EUR/USD extends gains toward 1.1700 in European trading on Friday, revisiting seven-week highs. The pair continues to benefit from persistent US Dollar selling bias, despite a cautious market mood. Traders await the US September PCE inflation and UoM Consumer Sentiment data for fresh impetus. 

GBP/USD holds gains near 1.3350 ahead of US data

GBP/USD sticks to a positive bias near 1.3350 in the European session on Friday. Traders prefer to wait on the sidelines ahead of the key US inflation and sentiment data due later in the day. In the meantime, broad-based US Dollar weakness keeps the pair underpinned. 

Gold edges higher amid dovish Fed expectations; traders await US PCE inflation data

Gold struggles to capitalize on the overnight bounce from the $4,175 area, or the vicinity of the weekly trough, and oscillates in a narrow trading range during the Asian session on Friday. Traders now seem reluctant and opt to move to the sidelines ahead of the September Personal Consumption Expenditures Price Index, or the Federal Reserve's preferred inflation gauge. 

Pi Network: Bearish streak nears critical support trendline

Pi Network edges lower on Friday for the third consecutive day, approaching a local support trendline. The on-chain data suggests an increase in supply pressure as Centralized Exchanges experience a surge in inflows. Technically, the pullback in PI risks further losses, as the Moving Average Convergence Divergence indicator is flashing a sell signal. 

Canada Unemployment Rate expected to edge higher in November ahead of BoC rate decision

Statistics Canada will release its Labour Force Survey on Friday, and markets are bracing for a weak print. The Unemployment Rate is expected to tick higher to 7% in November, while the Employment Change is forecast to come in flat after a nice gain in October.

Pi Network Price Forecast: Bearish streak nears critical support trendline

Pi Network (PI) edges lower on Friday for the third consecutive day, approaching a local support trendline. The on-chain data suggests an increase in supply pressure as Centralized Exchanges (CEXs) experience a surge in inflows.