|

USD/CHF Technical Analysis: Greenback hits a new 2019 high against CHF
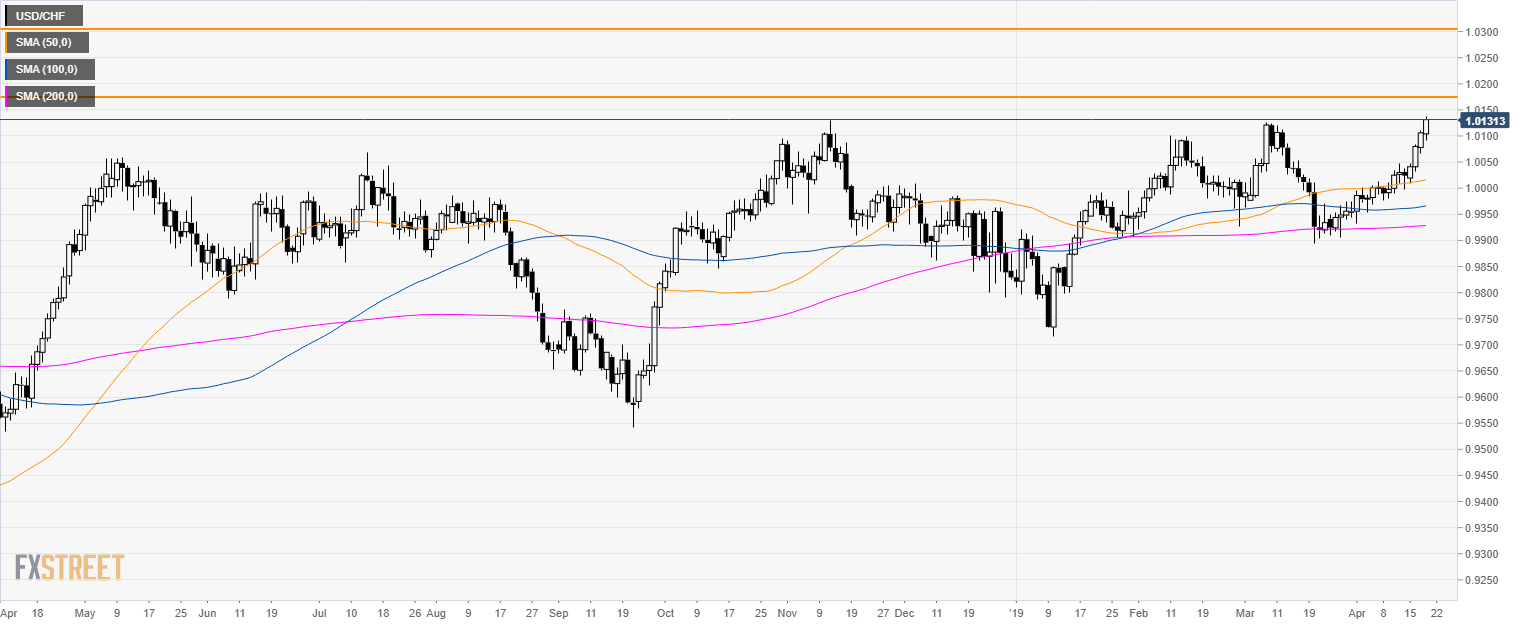
USD/CHF daily chart

  • USD/CHF is trading at its highest level since November 2018.

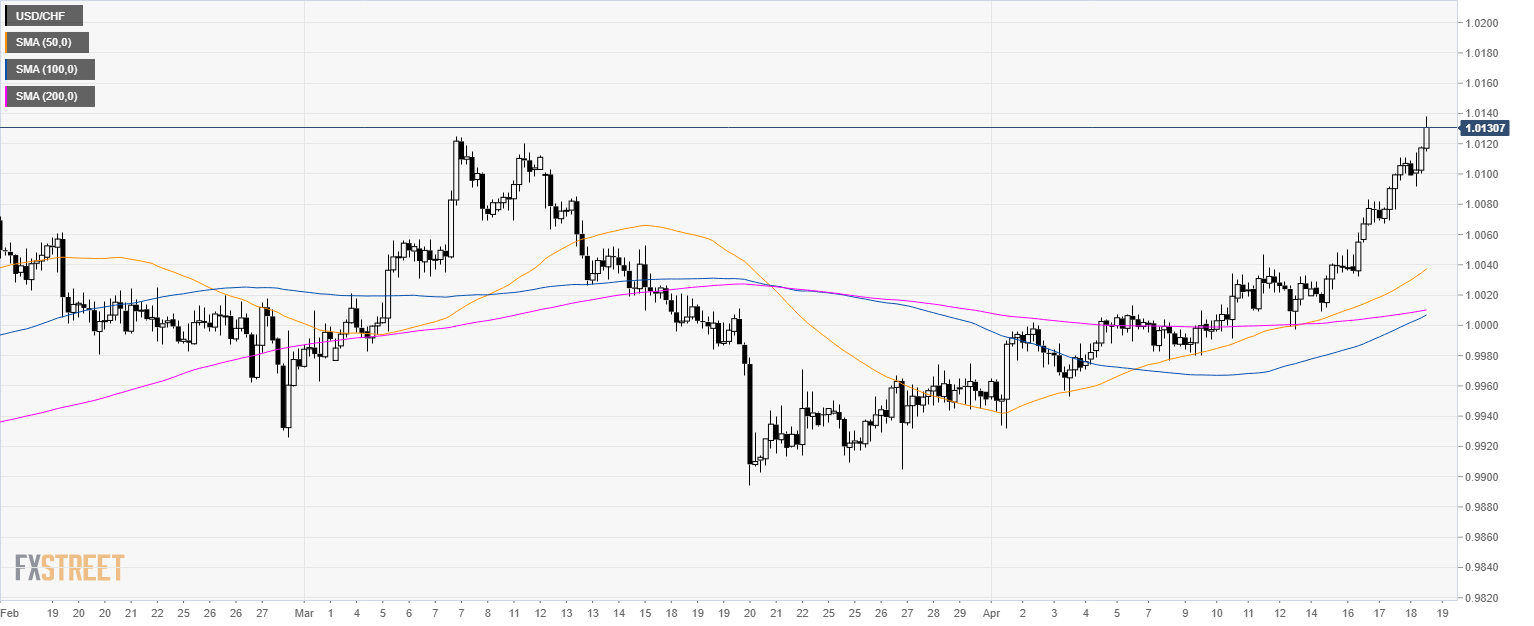
USD/CHF 4-hour chart

  • The 50 SMA crossed above the 200 SMA suggesting bullish momentum.

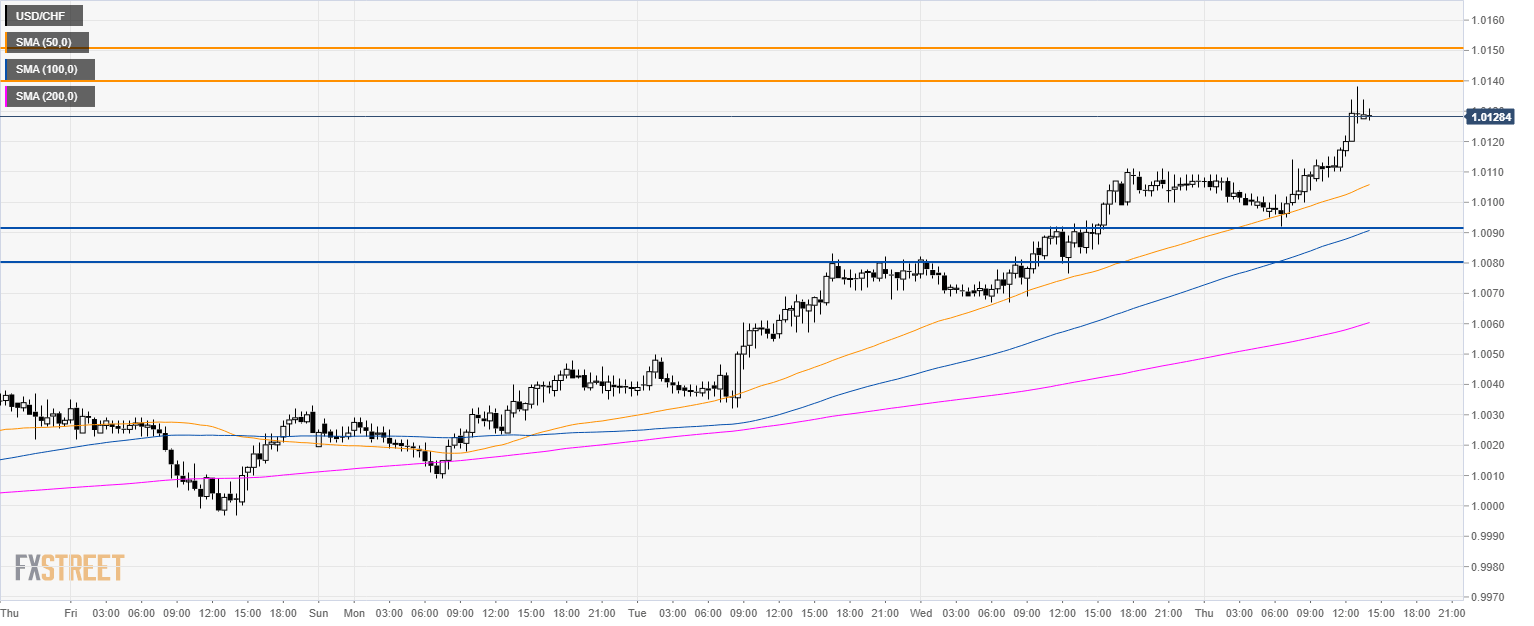
USD/CHF 30-minute chart

  • USD/CHF bulls need to overcome 1.0140/50 strong resistance. 
  • To the downside, support is seen all the way down to 1.0090/80 level.

Additional key levels

USD/CHF

Overview
Today last price1.0129
Today Daily Change0.0023
Today Daily Change %0.23
Today daily open1.0106
 
Trends
Daily SMA200.9991
Daily SMA501.0014
Daily SMA1000.9964
Daily SMA2000.9928
Levels
Previous Daily High1.0111
Previous Daily Low1.0067
Previous Weekly High1.0047
Previous Weekly Low0.9977
Previous Monthly High1.0125
Previous Monthly Low0.9894
Daily Fibonacci 38.2%1.0094
Daily Fibonacci 61.8%1.0084
Daily Pivot Point S11.0078
Daily Pivot Point S21.0051
Daily Pivot Point S31.0034
Daily Pivot Point R11.0122
Daily Pivot Point R21.0139
Daily Pivot Point R31.0166

Author

Flavio Tosti

Flavio Tosti

Independent Analyst


More from Flavio Tosti
Share:

Editor's Picks

EUR/USD tests nine-day EMA support near 1.1850

EUR/USD remains in the negative territory for the fourth successive session, trading around 1.1870 during the Asian hours on Friday. The 14-day Relative Strength Index momentum indicator at 56 stays above the midline, confirming steady momentum. RSI has eased but remains above 50, indicating momentum remains constructive for the bulls.

GBP/USD consolidates around 1.3600 vs. USD; looks to US CPI for fresh impetus

The GBP/USD pair remains on the defensive through the Asian session on Friday, though it lacks bearish conviction and holds above the 1.3600 mark as traders await the release of the US consumer inflation figures before placing directional bets.

Gold recovers swiftly from weekly low, climbs back closer to $5,000 ahead of US CPI

Gold regains positive traction during the Asian session on Friday and recovers a part of the previous day's heavy losses to the $4,878-4,877 region, or the weekly low. The commodity has now moved back closer to the $5,000 psychological mark as traders keenly await the release of the US consumer inflation figures for more cues about the Federal Reserve's policy path.

Solana: Mixed market sentiment caps recovery

Solana is trading at $79 as of Friday, following a correction of over 9% so far this week. On-chain and derivatives data indicates mixed sentiment among traders, further limiting the chances of a price recovery.

A tale of two labour markets: Headline strength masks underlying weakness

Undoubtedly, yesterday’s delayed US January jobs report delivered a strong headline – one that surpassed most estimates. However, optimism quickly faded amid sobering benchmark revisions.

Solana Price Forecast: Mixed market sentiment caps recovery

Solana (SOL) is trading at $79 as of Friday, following a correction of over 9% so far this week. On-chain and derivatives data indicates mixed sentiment among traders, further limiting the chances of a price recovery.