USD/CHF rallies as US-China trade truce lifts Dollar sentiment
- USD/CHF trades higher as the US Dollar strengthens on news of a 90-day tariff reduction deal between the US and China.
- The US 10-year Treasury yield hits 4.4500%, boosting USD demand, while the Swiss Franc lags amid reduced safe-haven flows.
- Key support levels for USD/CHF are 0.8910, 0.8880 and 0.8850, while resistance sits at 0.9050, 0.9080 and 0.9110.

The USD/CHF pair is trading higher, supported by a broad rally in the US Dollar (USD) following a significant breakthrough in US-China trade relations. The two countries have agreed to a 90-day pause in their trade war, with the US cutting tariffs on Chinese goods to 30% (from 145%) and China reducing its duties to 10% (from 125%). This move has bolstered market sentiment, driving the US Dollar Index (DXY) up over 1% to its highest level in a month, near 101.90. The rally comes despite Federal Reserve (Fed) Governor Adriana Kugler's warning that rapid shifts in trade policy have made it difficult for policymakers to assess the underlying strength of the US economy.
The US Dollar has received significant support from rising bond yields, with the 10-year US Treasury yield pushing to 4.4500%, reflecting reduced expectations for near-term Fed rate cuts. Market sentiment remains bullish as investors digest the implications of the 90-day tariff truce, which has temporarily eased pressure on global trade flows. The Atlanta Fed GDPNow model currently projects Q2 growth at 2.30% SAAR, highlighting the resilience of the US economy despite ongoing challenges.
In contrast, the Swiss Franc (CHF) has lagged, reflecting reduced safe-haven demand as the global risk environment improves. The Swiss National Bank (SNB) continues to face headwinds as it manages the impact of a strong currency on its export-oriented economy. The Swiss Franc's recent underperformance against the US Dollar underscores this dynamic, with the EUR/CHF also trading higher near 0.9384.
Technical Analysis
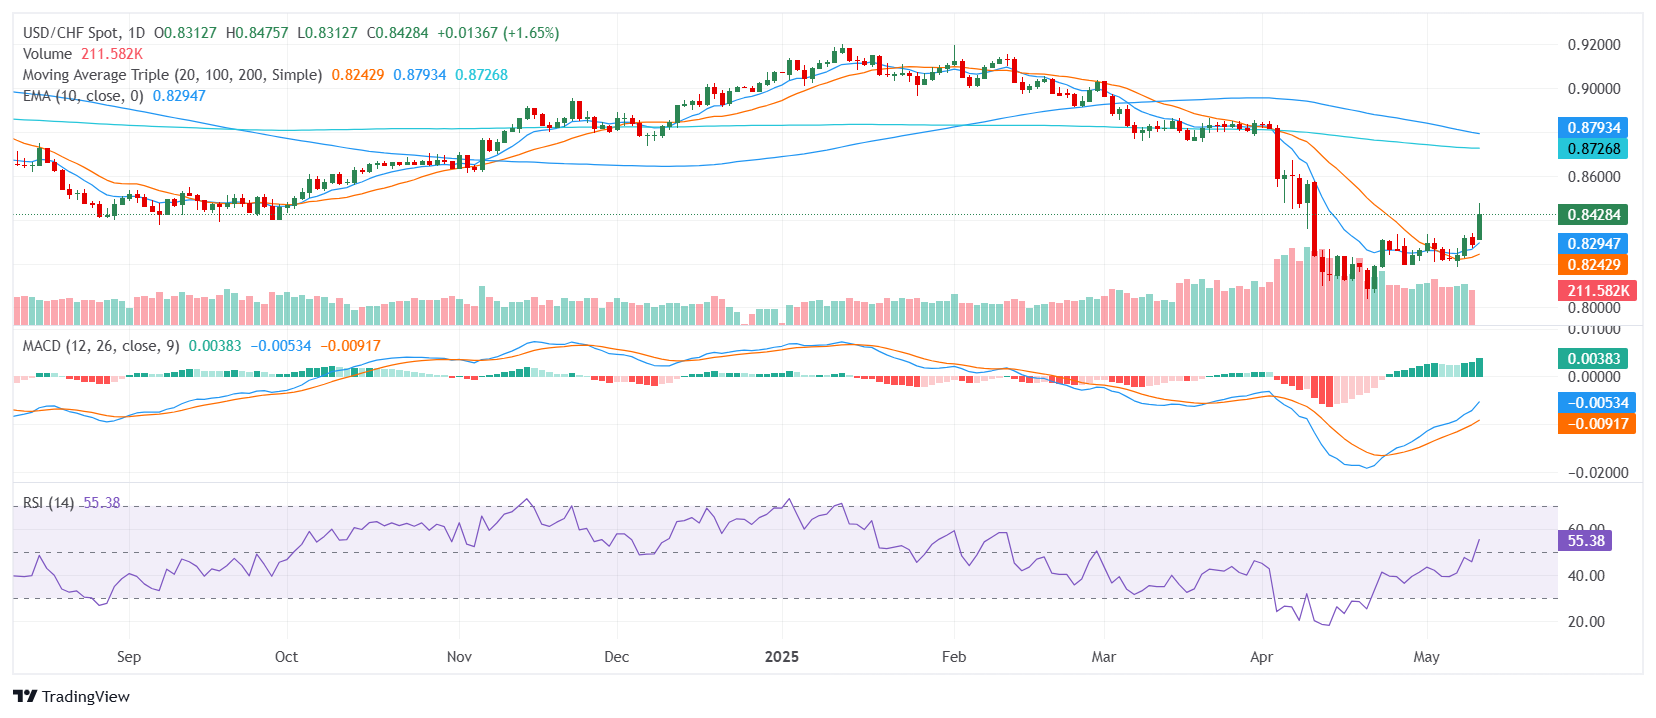
The USD/CHF is displaying a bullish signal, currently trading around 0.9000, with the 20-day Simple Moving Average (SMA) providing immediate support. The pair has cleared the critical 0.8910 level, which now acts as the first line of support, followed by 0.8880 and 0.8850. On the upside, resistance is seen at 0.9050, 0.9080, and 0.9110.
Momentum indicators are mixed, with the Relative Strength Index (RSI) hovering in the mid-60s, reflecting neutral to slightly bullish conditions. Meanwhile, the Moving Average Convergence Divergence (MACD) is signaling continued upward momentum, reinforcing the positive technical outlook. However, the Average Directional Index (ADX) remains subdued in the low 20s, suggesting that the current uptrend lacks strong conviction.
Daily Chart
Author

Patricio Martín
FXStreet
Patricio is an economist from Argentina passionate about global finance and understanding the daily movements of the markets.