|

USD/CHF Price Prediction: Potential start of an up leg within range

  • USD/CHF might be starting a new up leg within its sideways market range. 
  • MACD is starting to bend and if it crosses its signal line bulls may pile in. 

USD/CHF has fallen to the 0.8400 floor of the range and rebounded. It is too early to decide whether this is the start of a new up leg within the range but given the established sideways trend the odds favor such a move developing and the range extending. 

USD/CHF 4-hour Chart 

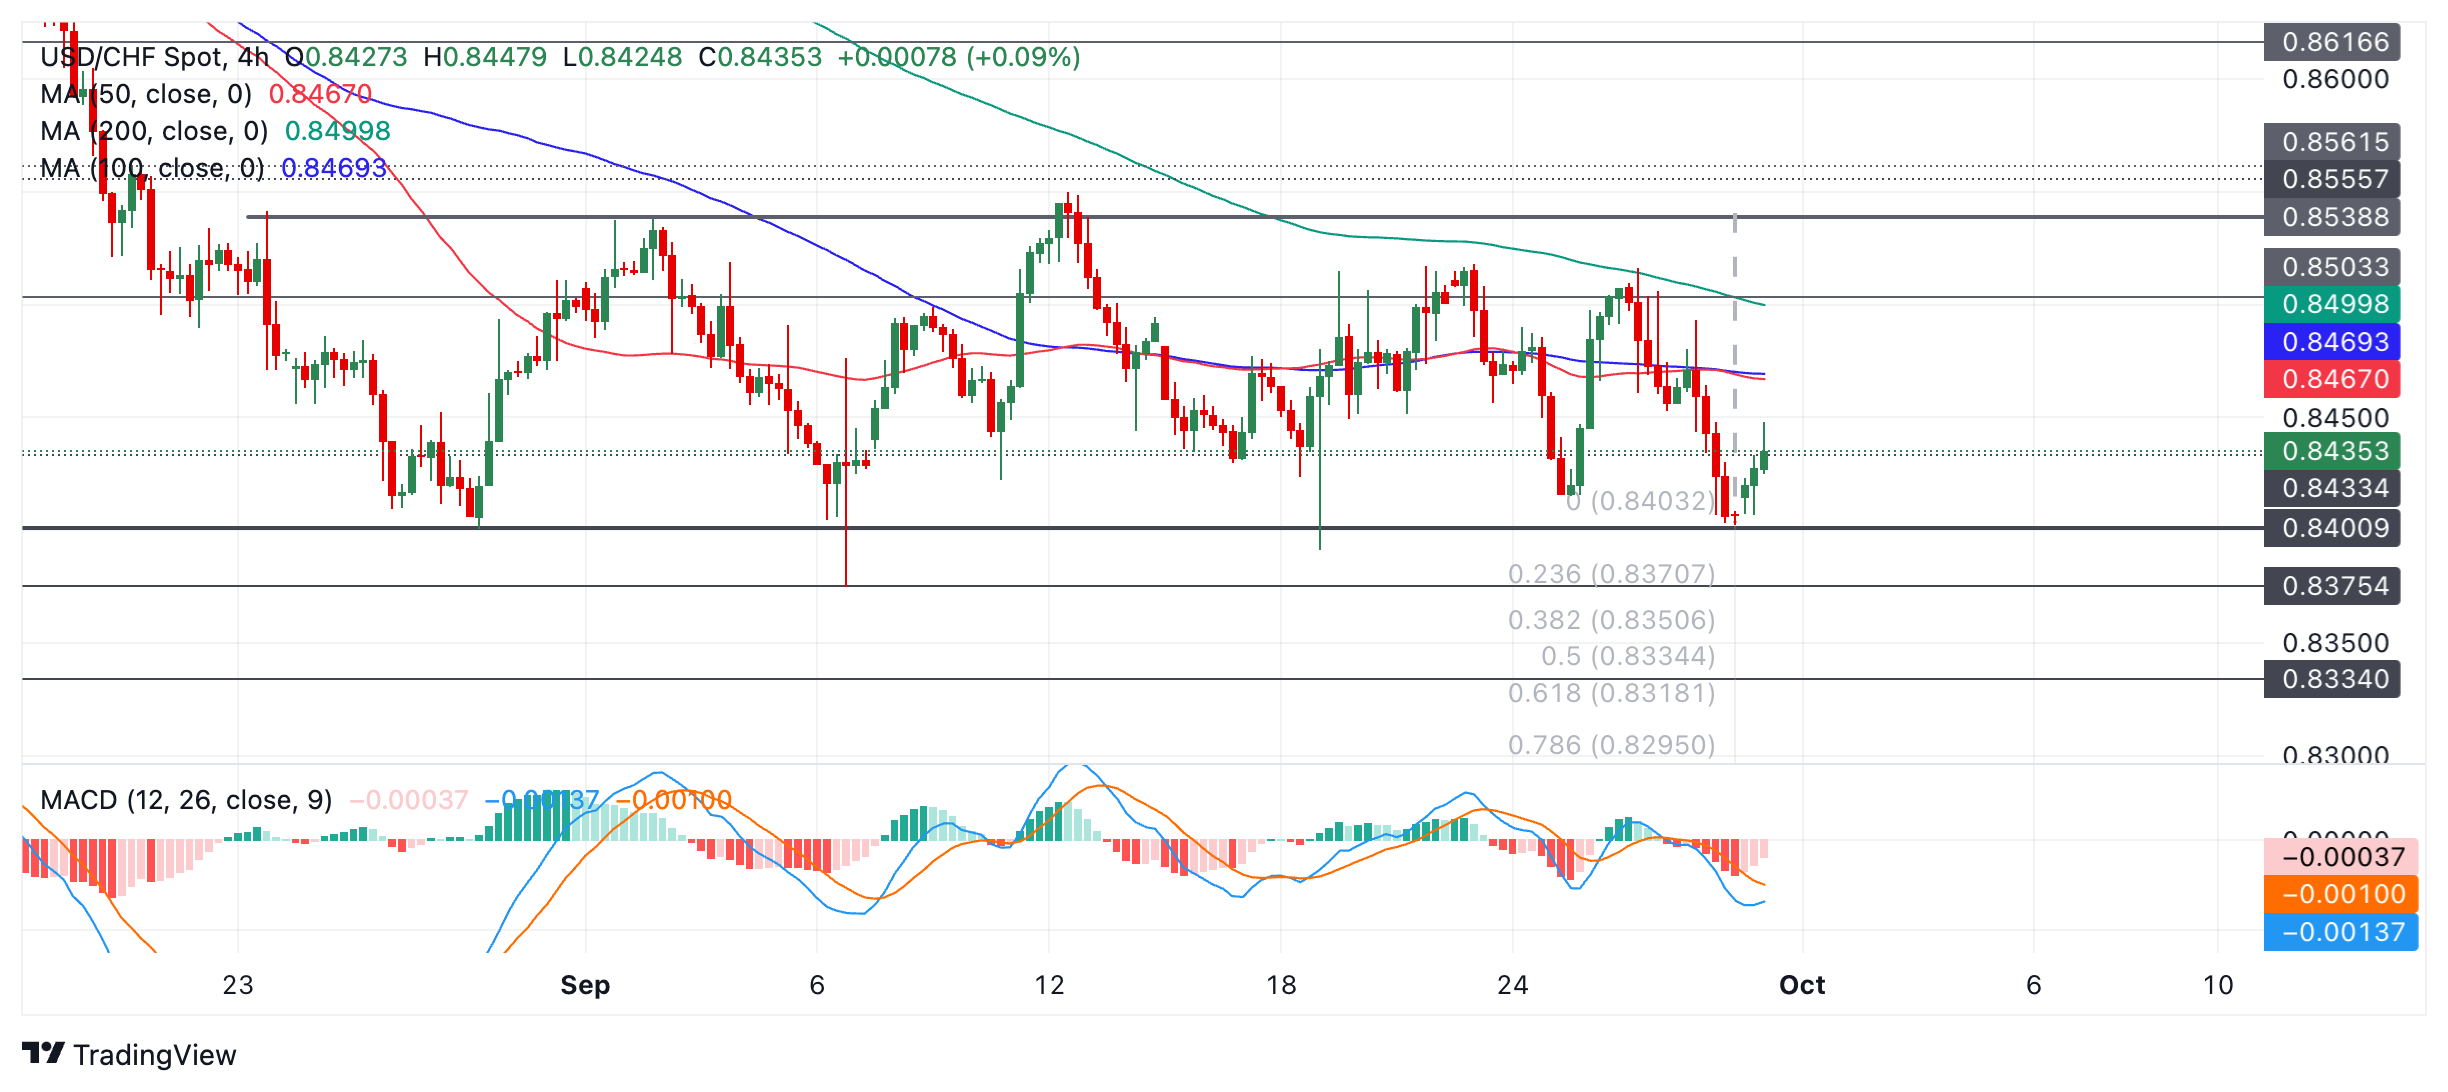
The Moving Average Convergence Divergence (MACD) momentum indicator is below the zero line and turning. If the blue MACD crosses above the red signal line it will provide a stronger signal that a new up leg within the range-bound consolidation is forming. MACD is a more reliable indicator within sideways compared to strongly trending markets

If the MACD line crosses above its signal line and price continues to rise it will probably continue all the way up to an initial target at about 0.8517 (September 23 and 26 highs) followed by the roof of the range at 0.8539. 

There is a possibility the pair could breakout of the range and given the prior trend to its formation was bearish, a downside break is mildly favored. A close below 0.8375 (September 6 low) would signal such a breakout. A decisive break would be one accompanied by a longer-than-average red candlestick that closed near its low or three consecutive bearish candles that broke below the level. Such a move would be expected to go as low as 0.8318, the 61.8% Fibonacci extrapolation of the height of the range extrapolated lower.  

Author

Joaquin Monfort

Joaquin Monfort is a financial writer and analyst with over 10 years experience writing about financial markets and alt data. He holds a degree in Anthropology from London University and a Diploma in Technical analysis.

More from Joaquin Monfort
Share:

Editor's Picks

EUR/USD accelerates losses, focus is on 1.1800

EUR/USD’s selling pressure is gathering pace now, opening the door to a potential test of the key 1.1800 region sooner rather than later. The pair’s pullback comes on the back of marked gains in the US Dollar following US data releases and the publication of the FOMC Minutes later in the day.

GBP/USD turns negative near 1.3540

GBP/USD reverses its initial upside momentum and is now adding to previous declines, revisiting at the same time the 1.3540 region on Wednesday. Cable’s downtick comes on the back of decent gains in the Greenback and easing UK inflation figures, which seem to have reinforced the case for a BoE rate cut in March.

Gold picks pace, flirts with $5,000

Gold is back on the front foot on Wednesday, shaking off part of the early week softness and pushing higher towards the key $5,000 mark per troy ounce. The move comes ahead of the FOMC Minutes and is unfolding despite an intense rebound in the US Dollar.

Fed Minutes to shed light on January hold decision amid hawkish rate outlook

The Minutes of the Fed’s January 27-28 monetary policy meeting will be published today. Details of discussions on the decision to leave the policy rate unchanged will be scrutinized by investors.

Mixed UK inflation data no gamechanger for the Bank of England

Food inflation plunged in January, but service sector price pressure is proving stickier. We continue to expect Bank of England rate cuts in March and June. The latest UK inflation read is a mixed bag for the Bank of England, but we doubt it drastically changes the odds of a March rate cut.

Sui extends sideways action ahead of Grayscale’s GSUI ETF launch

Sui is extending its downtrend for the second consecutive day, trading at 0.95 at the time of writing on Wednesday. The Layer-1 token is down over 16% in February and approximately 34% from the start of the year, aligning with the overall bearish sentiment across the crypto market.