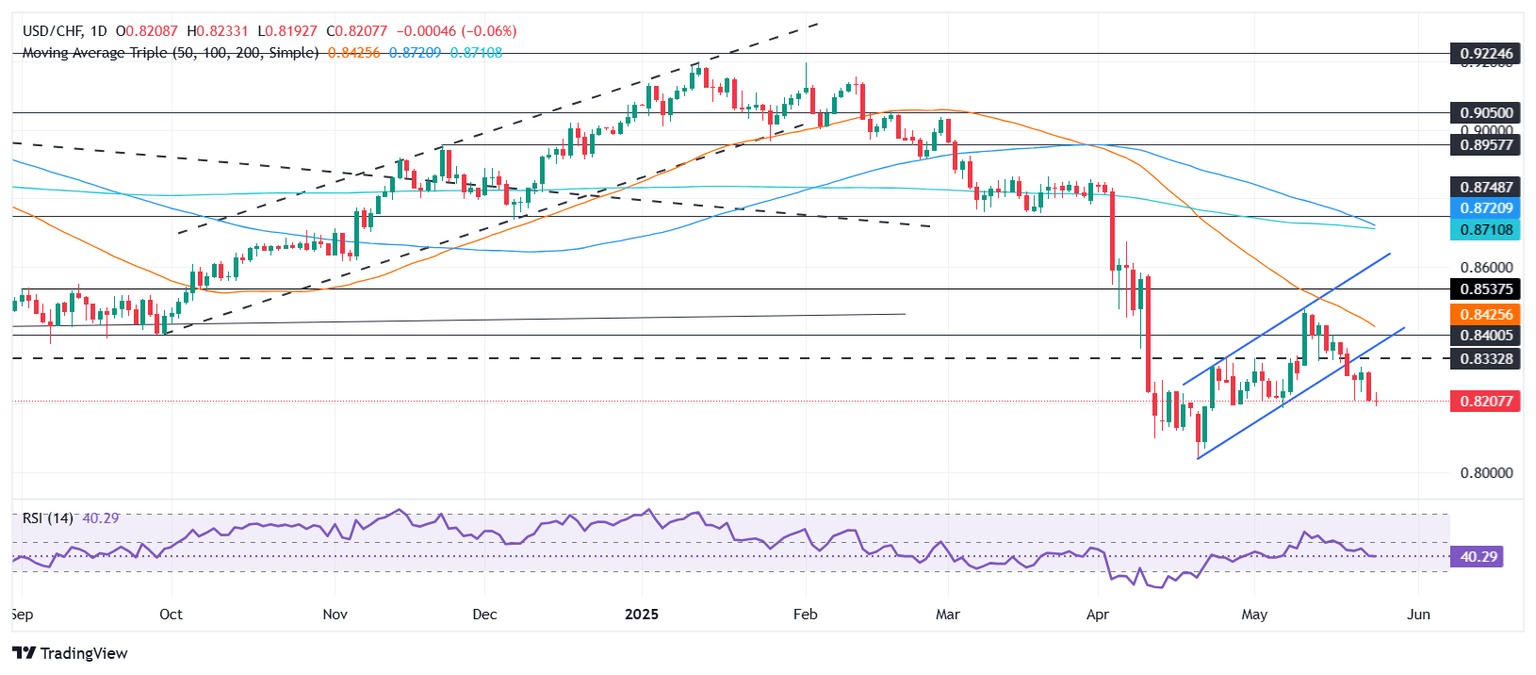
USD/CHF Price Forecast: Steady near three-week low, traders eye 0.8200 break
- USD/CHF hovers near 0.8207; a daily close below 0.8200 could accelerate the downside.
- RSI signals bearish momentum building as pair tests May 7 low of 0.8184.
- Bulls must clear 0.8250 to shift short-term bias, with 0.8300 as the next resistance.

USD/CHF clings to minimal gains of 0.03% on Monday amid the lack of trading activity due to the United States (US) markets being closed for the Memorial Day holiday. However, on Sunday, US President Donald Trump's comments boosted the Greenback after he postponed tariffs on the European Union (EU). At the time of writing, the pair trades at 0.8207.
USD/CHF Price Forecast: Technical outlook
The downtrend is set to continue even though the USD/CHF fall paused due to subdued trading on Monday. Despite this, the pair tumbled to a new three-week low of 0.8191, and if a daily close below 0.8200 is achieved, expect further downside.
The Relative Strength Index (RSI) suggests that further downside is expected as the RSI falls and widens the distance from its neutral line, indicating that sellers are gathering steam.
That said, the next support for USD/CHF would be the May 7 low of 0.8184. Once surpassed, the next line of defense would be the 0.81 figure, followed by the year-to-date (YTD) low of 0.8038.
Conversely, if USD/CHF climbs past 0.8250, this will exert upward pressure on the pair. Buyer's next goal will be the 0.8300 mark. Moving above the latter will expose the 50-day Simple Moving Average (SMA) at 0.8419.
USD/CHF Price Chart – Daily
Swiss Franc PRICE Today
The table below shows the percentage change of Swiss Franc (CHF) against listed major currencies today. Swiss Franc was the strongest against the Japanese Yen.
| USD | EUR | GBP | JPY | CAD | AUD | NZD | CHF | |
|---|---|---|---|---|---|---|---|---|
| USD | -0.17% | -0.26% | 0.21% | 0.03% | 0.08% | -0.22% | -0.02% | |
| EUR | 0.17% | -0.09% | 0.42% | 0.19% | 0.24% | -0.05% | 0.16% | |
| GBP | 0.26% | 0.09% | 0.17% | 0.28% | 0.33% | 0.05% | 0.27% | |
| JPY | -0.21% | -0.42% | -0.17% | -0.19% | -0.16% | -0.49% | -0.24% | |
| CAD | -0.03% | -0.19% | -0.28% | 0.19% | 0.07% | -0.23% | -0.01% | |
| AUD | -0.08% | -0.24% | -0.33% | 0.16% | -0.07% | -0.33% | -0.06% | |
| NZD | 0.22% | 0.05% | -0.05% | 0.49% | 0.23% | 0.33% | 0.22% | |
| CHF | 0.02% | -0.16% | -0.27% | 0.24% | 0.01% | 0.06% | -0.22% |
The heat map shows percentage changes of major currencies against each other. The base currency is picked from the left column, while the quote currency is picked from the top row. For example, if you pick the Swiss Franc from the left column and move along the horizontal line to the US Dollar, the percentage change displayed in the box will represent CHF (base)/USD (quote).
Author

Christian Borjon Valencia
FXStreet
Markets analyst, news editor, and trading instructor with over 14 years of experience across FX, commodities, US equity indices, and global macro markets.


