USD/CHF Price Forecast: Steady near 0.8050, awaiting NFP data
- USD/CHF trades at 0.8056, stuck between 0.8050–0.8100 range as buyers and sellers lack clear control.
- Bears eye 0.7985 August low for downside extension, while bulls target 0.8104 and 100-day SMA at 0.8123.
- RSI hovers at neutral 50; Nonfarm Payrolls seen as decisive trigger for next directional breakout.

The USD/CHF remains steady at around the 50-day Simple Moving Average (SMA) of 0.8051, consolidates at around the 0.8050-0.8100 figure for the fourth straight day. At the time of writing, the pair trades at 0.8056 up 0.01%.
USD/CHF Price Forecast: Technical outlook
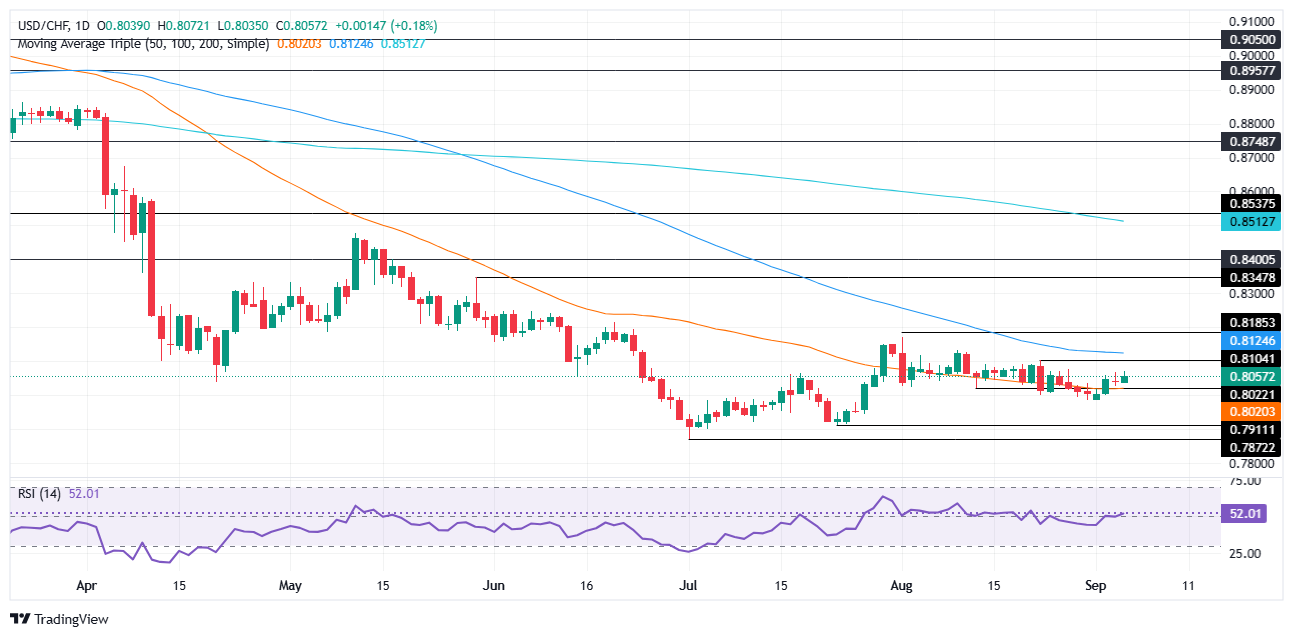
Price action shows that neither buyers nor sellers are in control as the USD/CHF meanders around 0.8050. Worth noting that to resume the downtrend, bears must clear the August 29 low of 0.7985 In orders to drop and challenge July 23 low of 0.7911.
On the other hand, bulls reclaim the August 22 high of 0.8104 and look for a rally toward the 100-day SMA at 0.8123.
From a momentum standpoint, the Relative Strength Index (RSI) adds to the ongoing confusion, standing near the 50 neutral line, without providing clues on who’s winning the battle: the bulls or the bears.
Given that conclusion, traders should wait for a catalyst, before opening fresh bets in the USD/CHF pair. With Nonfarm Payroll figures to be released, an upbeat report could warrant further upside on the pair. Otherwise, hints of jobs market weakness suggests that the Federal Reserve could ease policy, a sign cheered by the bears.
USD/CHF Price Chart – Daily
Swiss Franc Price This week
The table below shows the percentage change of Swiss Franc (CHF) against listed major currencies this week. Swiss Franc was the strongest against the Japanese Yen.
| USD | EUR | GBP | JPY | CAD | AUD | NZD | CHF | |
|---|---|---|---|---|---|---|---|---|
| USD | 0.40% | 0.47% | 0.99% | 0.61% | 0.44% | 0.74% | 0.80% | |
| EUR | -0.40% | 0.06% | 0.52% | 0.21% | 0.03% | 0.33% | 0.39% | |
| GBP | -0.47% | -0.06% | 0.36% | 0.15% | -0.03% | 0.28% | 0.37% | |
| JPY | -0.99% | -0.52% | -0.36% | -0.31% | -0.54% | -0.22% | -0.18% | |
| CAD | -0.61% | -0.21% | -0.15% | 0.31% | -0.16% | 0.12% | 0.21% | |
| AUD | -0.44% | -0.03% | 0.03% | 0.54% | 0.16% | 0.30% | 0.39% | |
| NZD | -0.74% | -0.33% | -0.28% | 0.22% | -0.12% | -0.30% | 0.09% | |
| CHF | -0.80% | -0.39% | -0.37% | 0.18% | -0.21% | -0.39% | -0.09% |
The heat map shows percentage changes of major currencies against each other. The base currency is picked from the left column, while the quote currency is picked from the top row. For example, if you pick the Swiss Franc from the left column and move along the horizontal line to the US Dollar, the percentage change displayed in the box will represent CHF (base)/USD (quote).
Author

Christian Borjon Valencia
FXStreet
Markets analyst, news editor, and trading instructor with over 14 years of experience across FX, commodities, US equity indices, and global macro markets.


