USD/CHF Price Forecast: Slips below 0.7950 as bears gain momentum
- USD/CHF rejected at 20-day SMA near 0.7970, slipping beneath 0.7950 support in early-week trading.
- Bearish RSI tilt and “dark cloud cover” pattern increase probability of revisiting last Friday’s 0.7911 low.
- Break below 0.7911 could expose yearly trough at 0.7829, while recovery above 0.8000 would ease downside bias.

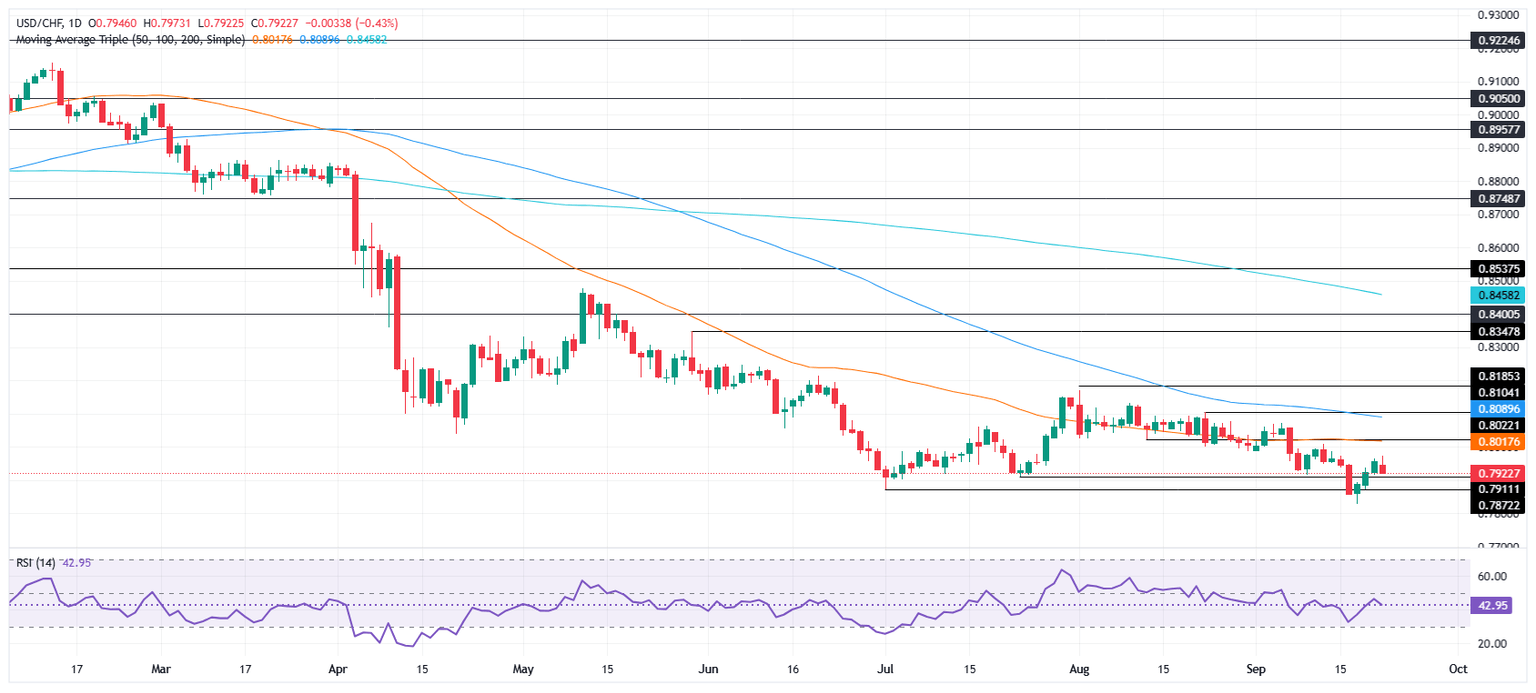
The USD/CHF retreats on Monday as the technical picture suggest the downtrend might resume in the near term. At the time of writing, the pair trades at 0.7923 below the 0.8000 figure, poised to test yearly lows of 0.7829.
USD/CHF Price Forecast: Technical outlook
The USD/CHF failed to clear strong resistance at the 20-day SMA at 0.7970 and fell below 0.7950. The formation of a ‘dark cloud cover’ chart pattern, paves the way for further downside. However, sellers need to surpass last Friday’s low of 0.7911, which clears the path to test the yearly low.
From a momentum standpoint, the Relative Strength Index (RSI) aims lower and remains in bearish territory, increasing the likelihood of the USD/CHF testing lower prices.
Conversely, if USD/CHF climbs above 0.7950 and clears 0.7970 and 0.8000, this will increase bulls momentum, to challenge the 50-day SMA At 0.8015.
USD/CHF Price Chart – Daily
Swiss Franc Price This Month
The table below shows the percentage change of Swiss Franc (CHF) against listed major currencies this month. Swiss Franc was the strongest against the Canadian Dollar.
| USD | EUR | GBP | JPY | CAD | AUD | NZD | CHF | |
|---|---|---|---|---|---|---|---|---|
| USD | -0.89% | -0.14% | 0.47% | 0.65% | -0.79% | 0.37% | -0.91% | |
| EUR | 0.89% | 0.76% | 1.32% | 1.55% | 0.10% | 1.27% | -0.02% | |
| GBP | 0.14% | -0.76% | 0.44% | 0.79% | -0.65% | 0.52% | -0.72% | |
| JPY | -0.47% | -1.32% | -0.44% | 0.24% | -1.25% | -0.07% | -1.35% | |
| CAD | -0.65% | -1.55% | -0.79% | -0.24% | -1.42% | -0.27% | -1.50% | |
| AUD | 0.79% | -0.10% | 0.65% | 1.25% | 1.42% | 1.18% | -0.07% | |
| NZD | -0.37% | -1.27% | -0.52% | 0.07% | 0.27% | -1.18% | -1.23% | |
| CHF | 0.91% | 0.02% | 0.72% | 1.35% | 1.50% | 0.07% | 1.23% |
The heat map shows percentage changes of major currencies against each other. The base currency is picked from the left column, while the quote currency is picked from the top row. For example, if you pick the Swiss Franc from the left column and move along the horizontal line to the US Dollar, the percentage change displayed in the box will represent CHF (base)/USD (quote).
Author

Christian Borjon Valencia
FXStreet
Markets analyst, news editor, and trading instructor with over 14 years of experience across FX, commodities, US equity indices, and global macro markets.


