USD/CHF Price Forecast: Holds above 0.8200 post-Fed meeting
- USD/CHF trades within tight 0.8200–0.8335 range as markets await breakout confirmation.
- Soft Swiss CPI boosts rate cut expectations from SNB, supporting mild USD/CHF rebound.
- Break above 0.8250 eyes 0.8300 and 0.8335; drop below 0.8200 may retest 0.8100 and 0.8038 lows.

USD/CHF consolidates on Wednesday, registering a daily close with gains of over 0.21%. The pair witnessed a drop from around 0.8847 to 0.8038, the yearly low in eleven days. However, it has recovered after Swiss Consumer Price Index (CPI) data continued to remain soft, paving the way for another rate cut by the Swiss National Bank (SNB).
At the time of writing, USD/CHF trades past the 0.8230 mark after bouncing off daily/weekly lows of 0.8184.
USD/CHF Price Forecast: Technical outlook
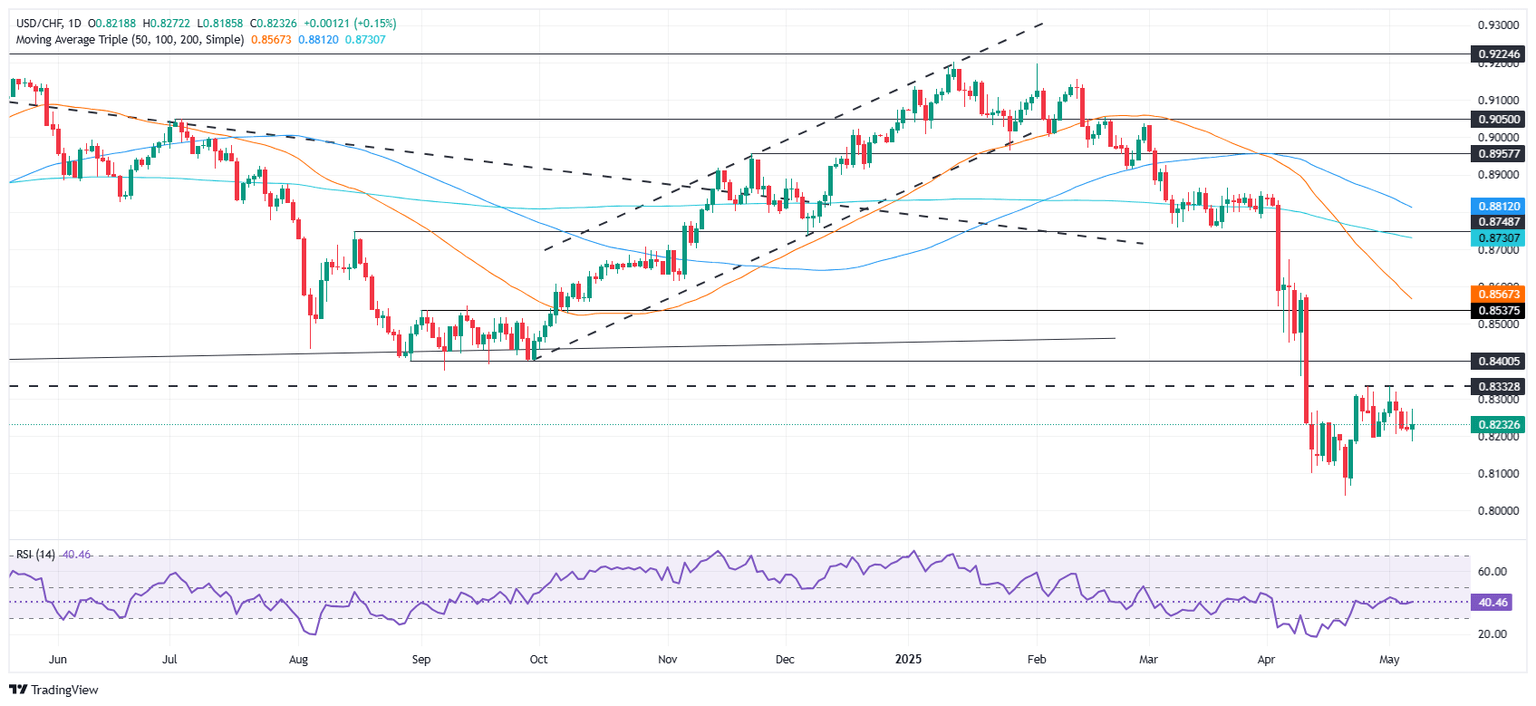
The USD/CHF has been trading sideways for the last nine days, within the 0.8200-0.8335 range, as market participants awaited the Federal Reserve’s decision. However, as Fed Chair Powell maintained the status quo, the major was unable to clear either the high or the low of the range. Therefore, the USD/CHF is set to remain range-bound.
Buying opportunities emerge at the 0.8200 figure. A breach of the 0.8250 mark would expose the 0.8300 figure, followed by the peak of the range at 0.8335. Conversely, if USD/CHF falls below 0.8200, traders could test the 0.8100 figure, followed by the yearly low of 0.8184.
USD/CHF Price Chart – Daily
Swiss Franc PRICE This week
The table below shows the percentage change of Swiss Franc (CHF) against listed major currencies this week. Swiss Franc was the strongest against the Australian Dollar.
| USD | EUR | GBP | JPY | CAD | AUD | NZD | CHF | |
|---|---|---|---|---|---|---|---|---|
| USD | 0.18% | -0.22% | -0.65% | 0.26% | 0.36% | 0.09% | -0.32% | |
| EUR | -0.18% | -0.12% | -0.59% | 0.35% | 0.53% | 0.18% | -0.23% | |
| GBP | 0.22% | 0.12% | -0.69% | 0.47% | 0.58% | 0.30% | -0.10% | |
| JPY | 0.65% | 0.59% | 0.69% | 0.94% | 1.06% | 0.87% | 0.49% | |
| CAD | -0.26% | -0.35% | -0.47% | -0.94% | -0.18% | -0.17% | -0.57% | |
| AUD | -0.36% | -0.53% | -0.58% | -1.06% | 0.18% | -0.25% | -0.68% | |
| NZD | -0.09% | -0.18% | -0.30% | -0.87% | 0.17% | 0.25% | -0.42% | |
| CHF | 0.32% | 0.23% | 0.10% | -0.49% | 0.57% | 0.68% | 0.42% |
The heat map shows percentage changes of major currencies against each other. The base currency is picked from the left column, while the quote currency is picked from the top row. For example, if you pick the Swiss Franc from the left column and move along the horizontal line to the US Dollar, the percentage change displayed in the box will represent CHF (base)/USD (quote).
Author

Christian Borjon Valencia
FXStreet
Christian Borjon began his career as a retail trader in 2010, mainly focused on technical analysis and strategies around it. He started as a swing trader, as he used to work in another industry unrelated to the financial markets.


