USD/CHF Price Forecast: Climbs to 0.8050 as risk aversion boosts USD
- USD/CHF extends rally for third day, as global risk-off mood favors USD over CHF.
- Technicals show bullish RSI and upside potential, with 0.8100 breakout opening path to 0.8126 and 0.8200.
- Downside risks persist below 50-day SMA at 0.8019, exposing 0.8000 psychological level and further weakness.

The USD/CHF advances for the third straight day, up by 0.57% on Tuesday trading at 0.8050 as risk aversion boosted the Greenback. Economic data revealed in the United States (US) was mixed, as business activity in the manufacturing sector showed that growth is slowing down.
Despite this, threats to Fed independence courtesy of pressures from the White House, along with uncertainty due to policies by the Trump administration, triggered inflows towards the US Dollar.
USD/CHF Price Forecast: Technical outlook
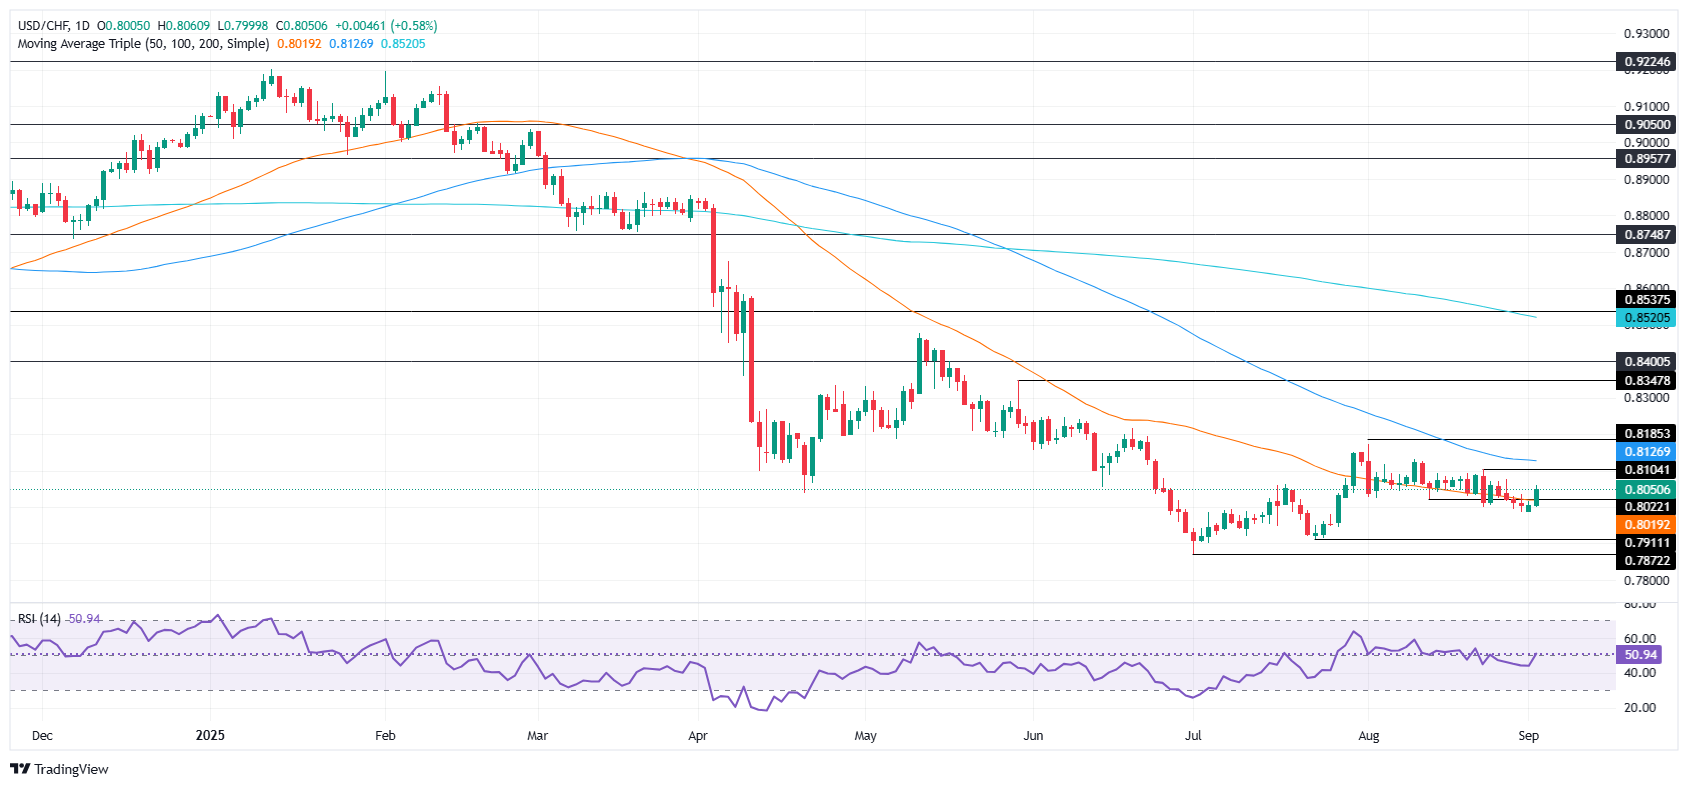
The USD/CHF continues to trade sideways, but it seems poised for a recovery after failing to test yearly lows of 0.7872. Also, the Relative Strength Index (RSI) turned bullish and about to clear the highest peak, which could pave the way for further upside on the major.
If buyers push the USD/CHF past 0.8100, expect a test of the 100-day SMA at 0.8126. A breach of the latter will expose the 0.8200 figure, followed by 0.8300 and the May 29 peak of 0.8347.
On the other hand, if the pair drops below the 50-day SMA at 0.8019, a move toward 0.8000 is on the cards.
USD/CHF Price Chart – Daily
Swiss Franc Price This week
The table below shows the percentage change of Swiss Franc (CHF) against listed major currencies this week. Swiss Franc was the strongest against the Japanese Yen.
| USD | EUR | GBP | JPY | CAD | AUD | NZD | CHF | |
|---|---|---|---|---|---|---|---|---|
| USD | 0.53% | 0.82% | 1.02% | 0.37% | 0.43% | 0.46% | 0.69% | |
| EUR | -0.53% | 0.28% | 0.41% | -0.16% | -0.11% | -0.07% | 0.16% | |
| GBP | -0.82% | -0.28% | 0.04% | -0.44% | -0.39% | -0.35% | -0.08% | |
| JPY | -1.02% | -0.41% | -0.04% | -0.59% | -0.59% | -0.53% | -0.31% | |
| CAD | -0.37% | 0.16% | 0.44% | 0.59% | 0.07% | 0.09% | 0.37% | |
| AUD | -0.43% | 0.11% | 0.39% | 0.59% | -0.07% | 0.03% | 0.31% | |
| NZD | -0.46% | 0.07% | 0.35% | 0.53% | -0.09% | -0.03% | 0.28% | |
| CHF | -0.69% | -0.16% | 0.08% | 0.31% | -0.37% | -0.31% | -0.28% |
The heat map shows percentage changes of major currencies against each other. The base currency is picked from the left column, while the quote currency is picked from the top row. For example, if you pick the Swiss Franc from the left column and move along the horizontal line to the US Dollar, the percentage change displayed in the box will represent CHF (base)/USD (quote).
Author

Christian Borjon Valencia
FXStreet
Markets analyst, news editor, and trading instructor with over 14 years of experience across FX, commodities, US equity indices, and global macro markets.


