USD/CHF Price Analysis: Subdued around 0.9635, despite forming a bearish-harami candle pattern


  • USD/CHF exchanges hands under its opening price, despite recovering from daily lows.
  • The USD/CHF is range-bound through a break of the top of the range will pave the way above the 0.9700 figure; otherwise, a fall towards 0.9550 is on the cards.

The USD/CHF drops into negative territory after refreshing five-week highs around 0.9650s, courtesy of broad US dollar weakness across the board, amidst an upbeat market mood. After hitting a daily high at 0.9626, the USD/CHF dived below the 50-day EMA at 0.9612, the day’s lows, before jumping to current price levels. At the time of writing, the USD/CHF trades at 0.9645, below its opening price.

USD/CHF Price Analysis: Technical outlook

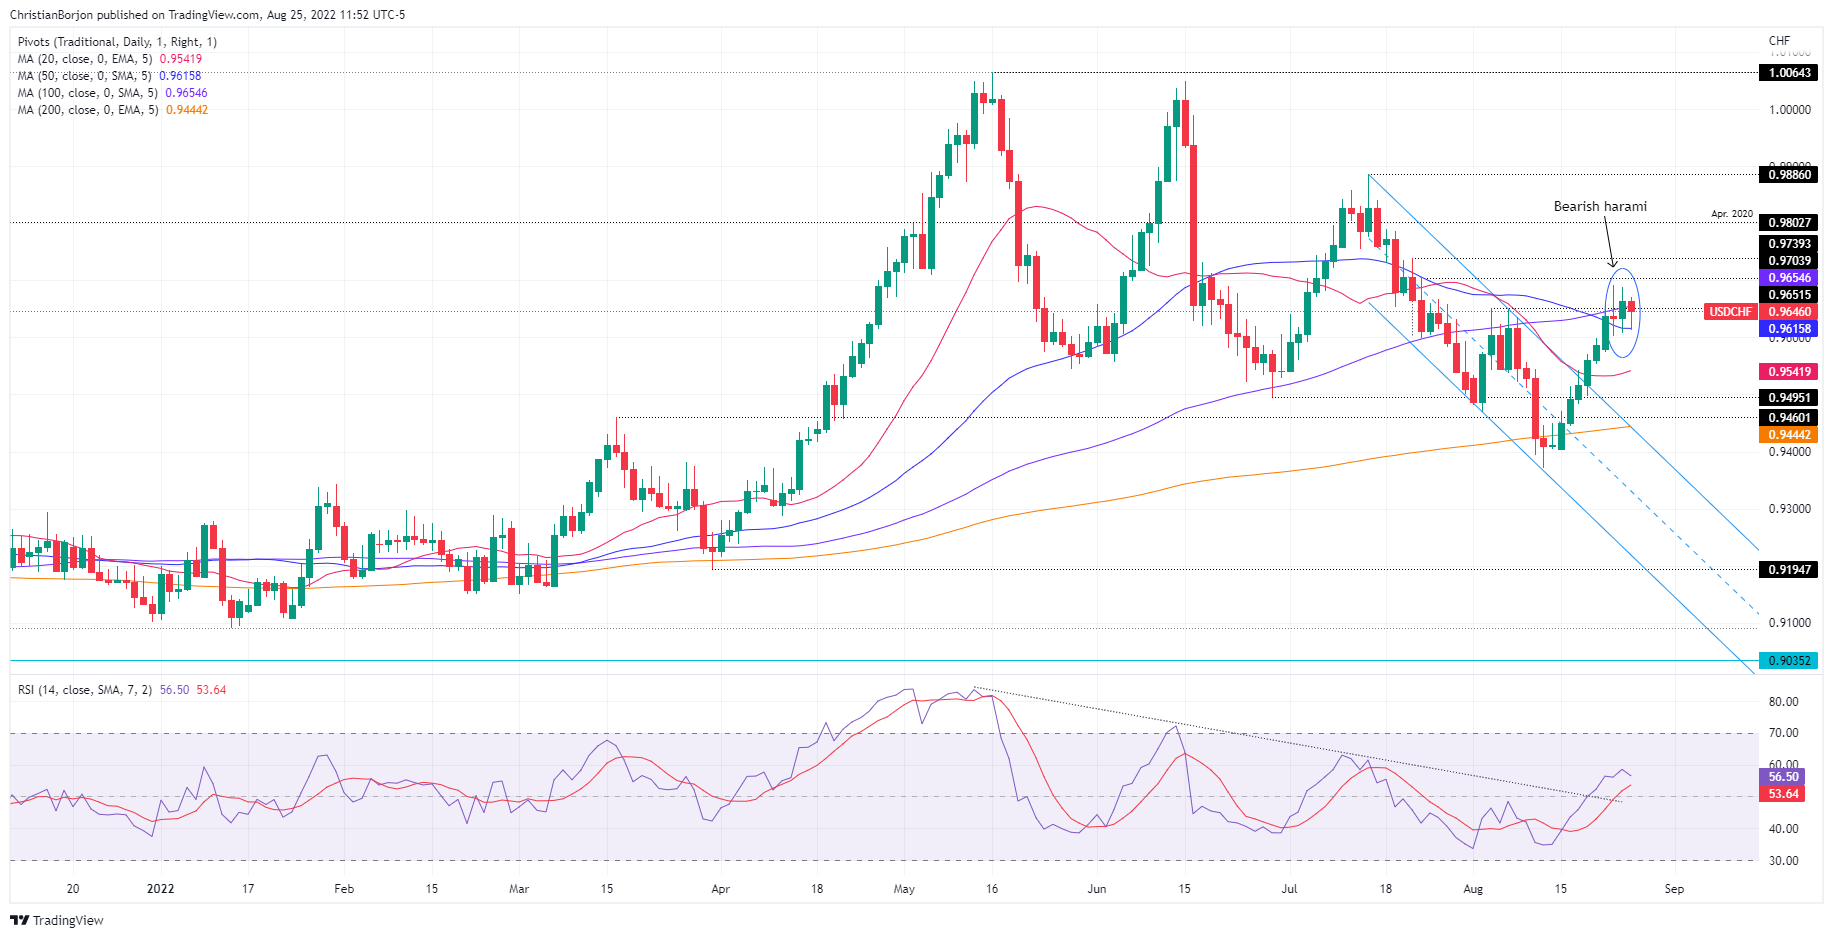
A bearish-harami candle chart pattern emerged in the USD/CHF daily chart. Even though the pattern has bearish implications, oscillators and moving averages (MAs) portray the opposite. Albeit the RSI has a downslope, it remains in positive territory. Meanwhile, all the daily Exponential Moving Averages are below the USD/CHF spot price, suggesting that buyers are in charge.

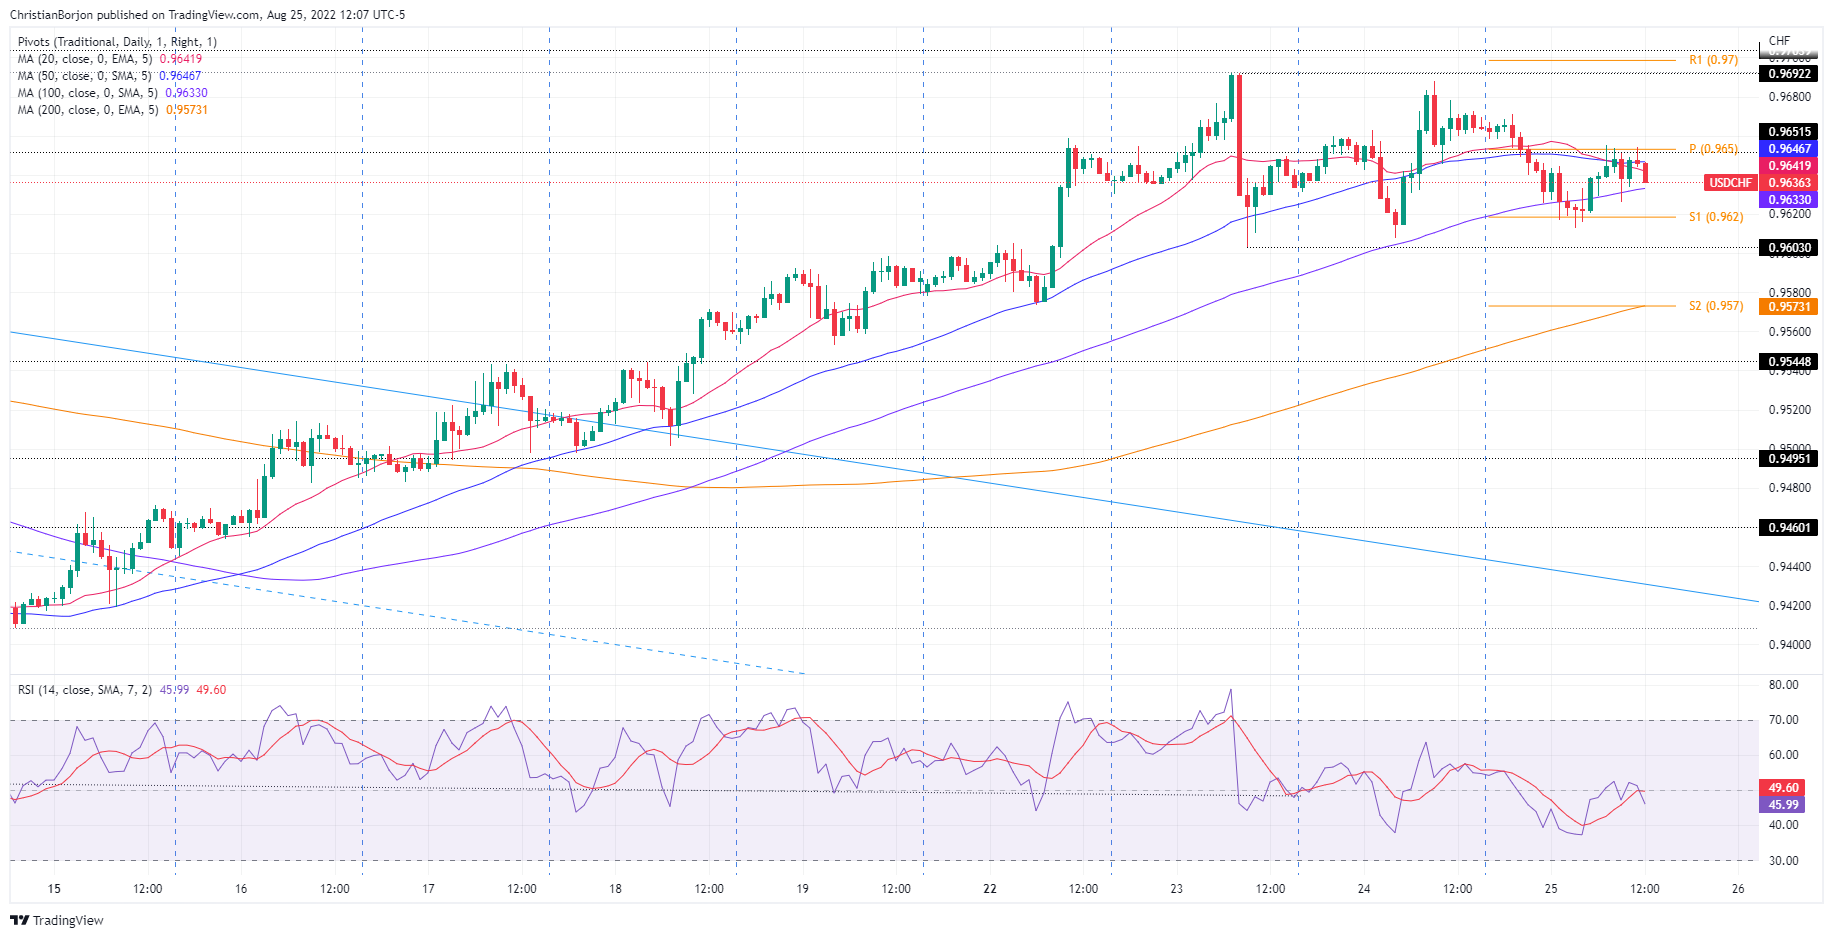
In the near term, the USD/CHF one-hour chart depicts the pair as range-bound within the 0.9603-0.9692 area for the last three days. Further confirmation of the previously mentioned is that the 20, 50, and 100 exponential moving averages (EMAs), are located within the 0.9632-46 area. Also, the Relative Strength Index (RSI) at 52 is almost flat.

Therefore, if the USD/CHF breaks above the range, the first resistance would be the 0.9700 figure. Once cleared, the next resistance would be the R2 daily pivot at 0.9733, followed by 0.9800. On the flip side, the USD/CHF first support would be the 0.9600 mark, followed by the confluence of the 200-EMA and the S2 pivot at 0.9570, and then the August 19 daily low at 0.9553.

USD/CHF Key Technical

USD/CHF

Overview
Today last price 0.9646
Today Daily Change -0.0020
Today Daily Change % -0.21
Today daily open 0.9666
 
Trends
Daily SMA20 0.9543
Daily SMA50 0.9622
Daily SMA100 0.9656
Daily SMA200 0.9447
 
Levels
Previous Daily High 0.9688
Previous Daily Low 0.9608
Previous Weekly High 0.9598
Previous Weekly Low 0.9409
Previous Monthly High 0.9886
Previous Monthly Low 0.9502
Daily Fibonacci 38.2% 0.9657
Daily Fibonacci 61.8% 0.9638
Daily Pivot Point S1 0.962
Daily Pivot Point S2 0.9574
Daily Pivot Point S3 0.954
Daily Pivot Point R1 0.97
Daily Pivot Point R2 0.9734
Daily Pivot Point R3 0.978


Share: Feed news

Information on these pages contains forward-looking statements that involve risks and uncertainties. Markets and instruments profiled on this page are for informational purposes only and should not in any way come across as a recommendation to buy or sell in these assets. You should do your own thorough research before making any investment decisions. FXStreet does not in any way guarantee that this information is free from mistakes, errors, or material misstatements. It also does not guarantee that this information is of a timely nature. Investing in Open Markets involves a great deal of risk, including the loss of all or a portion of your investment, as well as emotional distress. All risks, losses and costs associated with investing, including total loss of principal, are your responsibility. The views and opinions expressed in this article are those of the authors and do not necessarily reflect the official policy or position of FXStreet nor its advertisers. The author will not be held responsible for information that is found at the end of links posted on this page.

If not otherwise explicitly mentioned in the body of the article, at the time of writing, the author has no position in any stock mentioned in this article and no business relationship with any company mentioned. The author has not received compensation for writing this article, other than from FXStreet.

FXStreet and the author do not provide personalized recommendations. The author makes no representations as to the accuracy, completeness, or suitability of this information. FXStreet and the author will not be liable for any errors, omissions or any losses, injuries or damages arising from this information and its display or use. Errors and omissions excepted.

The author and FXStreet are not registered investment advisors and nothing in this article is intended to be investment advice.

Recommended content


Recommended content

Editors’ Picks

EUR/USD regains traction, recovers above 1.0700

EUR/USD regains traction, recovers above 1.0700

EUR/USD regained its traction and turned positive on the day above 1.0700 in the American session. The US Dollar struggles to preserve its strength after the data from the US showed that the economy grew at a softer pace than expected in Q1.

EUR/USD News

GBP/USD returns to 1.2500 area in volatile session

GBP/USD returns to 1.2500 area in volatile session

GBP/USD reversed its direction and recovered to 1.2500 after falling to the 1.2450 area earlier in the day. Although markets remain risk-averse, the US Dollar struggles to find demand following the disappointing GDP data.

GBP/USD News

Gold holds around $2,330 after dismal US data

Gold holds around $2,330 after dismal US data

Gold fell below $2,320 in the early American session as US yields shot higher after the data showed a significant increase in the US GDP price deflator in Q1. With safe-haven flows dominating the markets, however, XAU/USD reversed its direction and rose above $2,340.

Gold News

XRP extends its decline, crypto experts comment on Ripple stablecoin and benefits for XRP Ledger

XRP extends its decline, crypto experts comment on Ripple stablecoin and benefits for XRP Ledger

Ripple extends decline to $0.52 on Thursday, wipes out weekly gains. Crypto expert asks Ripple CTO how the stablecoin will benefit the XRP Ledger and native token XRP. 

Read more

After the US close, it’s the Tokyo CPI

After the US close, it’s the Tokyo CPI

After the US close, it’s the Tokyo CPI, a reliable indicator of the national number and then the BoJ policy announcement. Tokyo CPI ex food and energy in Japan was a rise to 2.90% in March from 2.50%.

Read more

Forex MAJORS

Cryptocurrencies

Signatures