|

USD/CHF Price Analysis: Soars post US NFP, reclaims 0.9600

  • The USD/CHF is snapping two consecutive weeks of losses, gaining 1.37%.
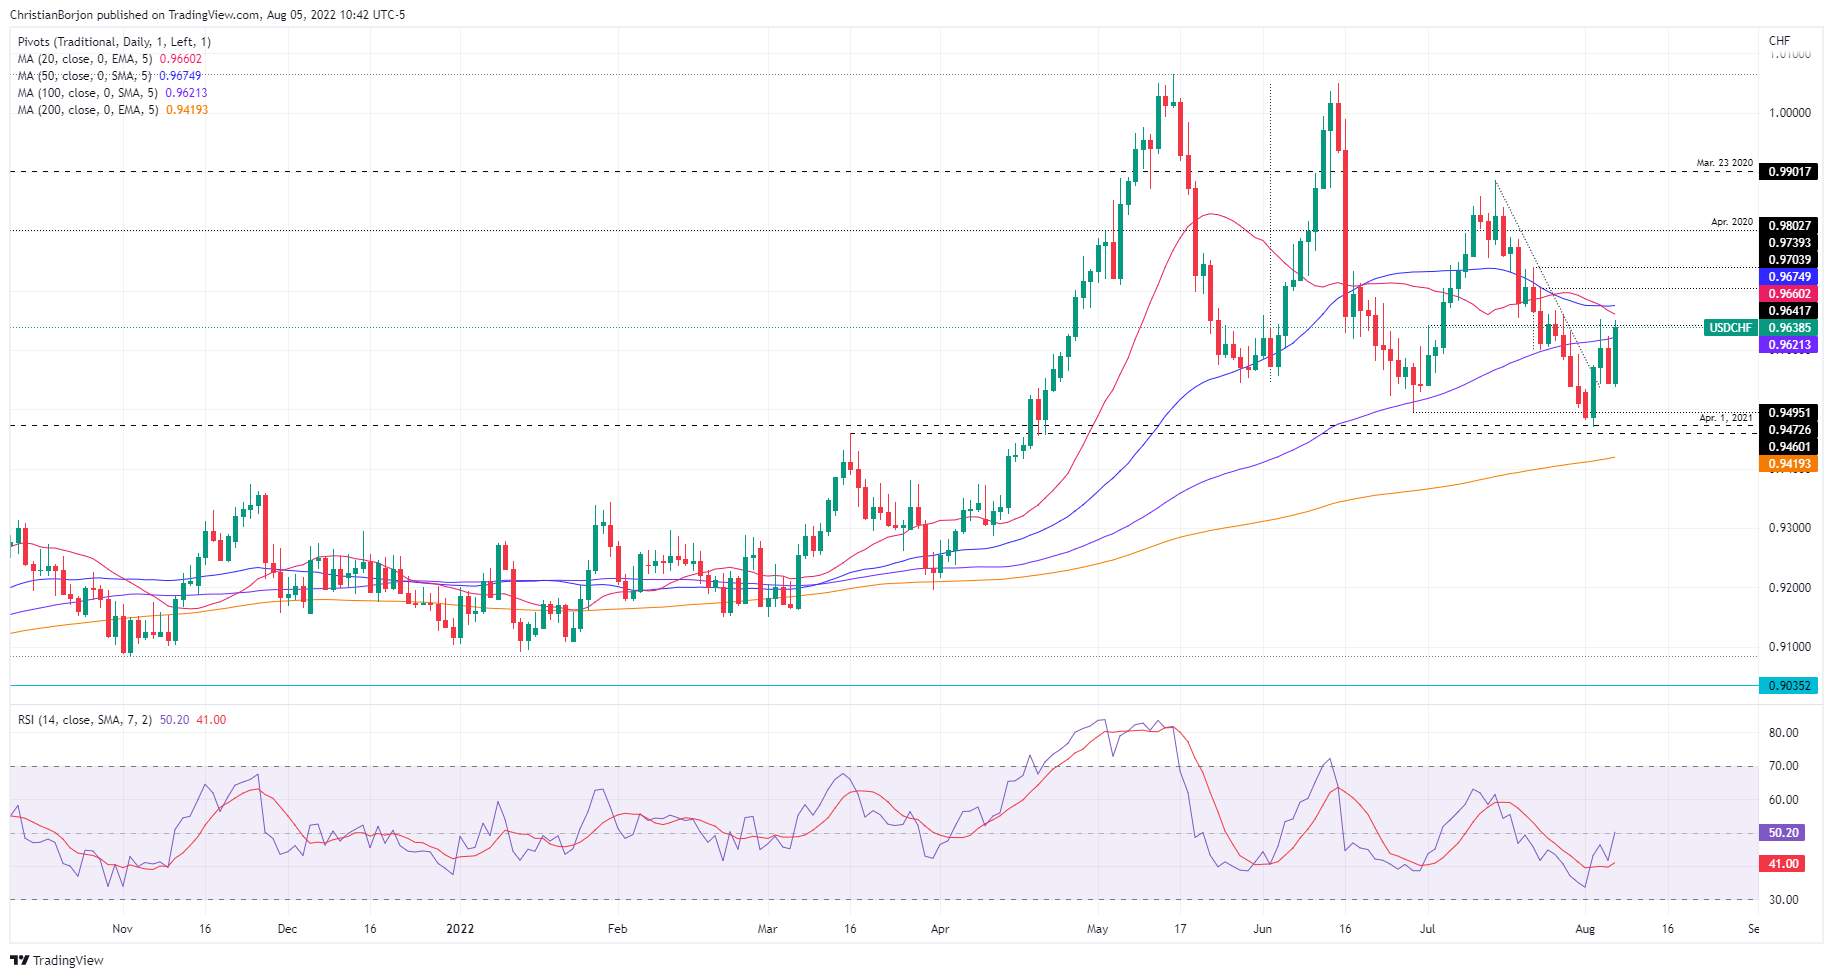
  • From the daily chart perspective, the major is headed upwards and will test resistance around 0.9669-75.
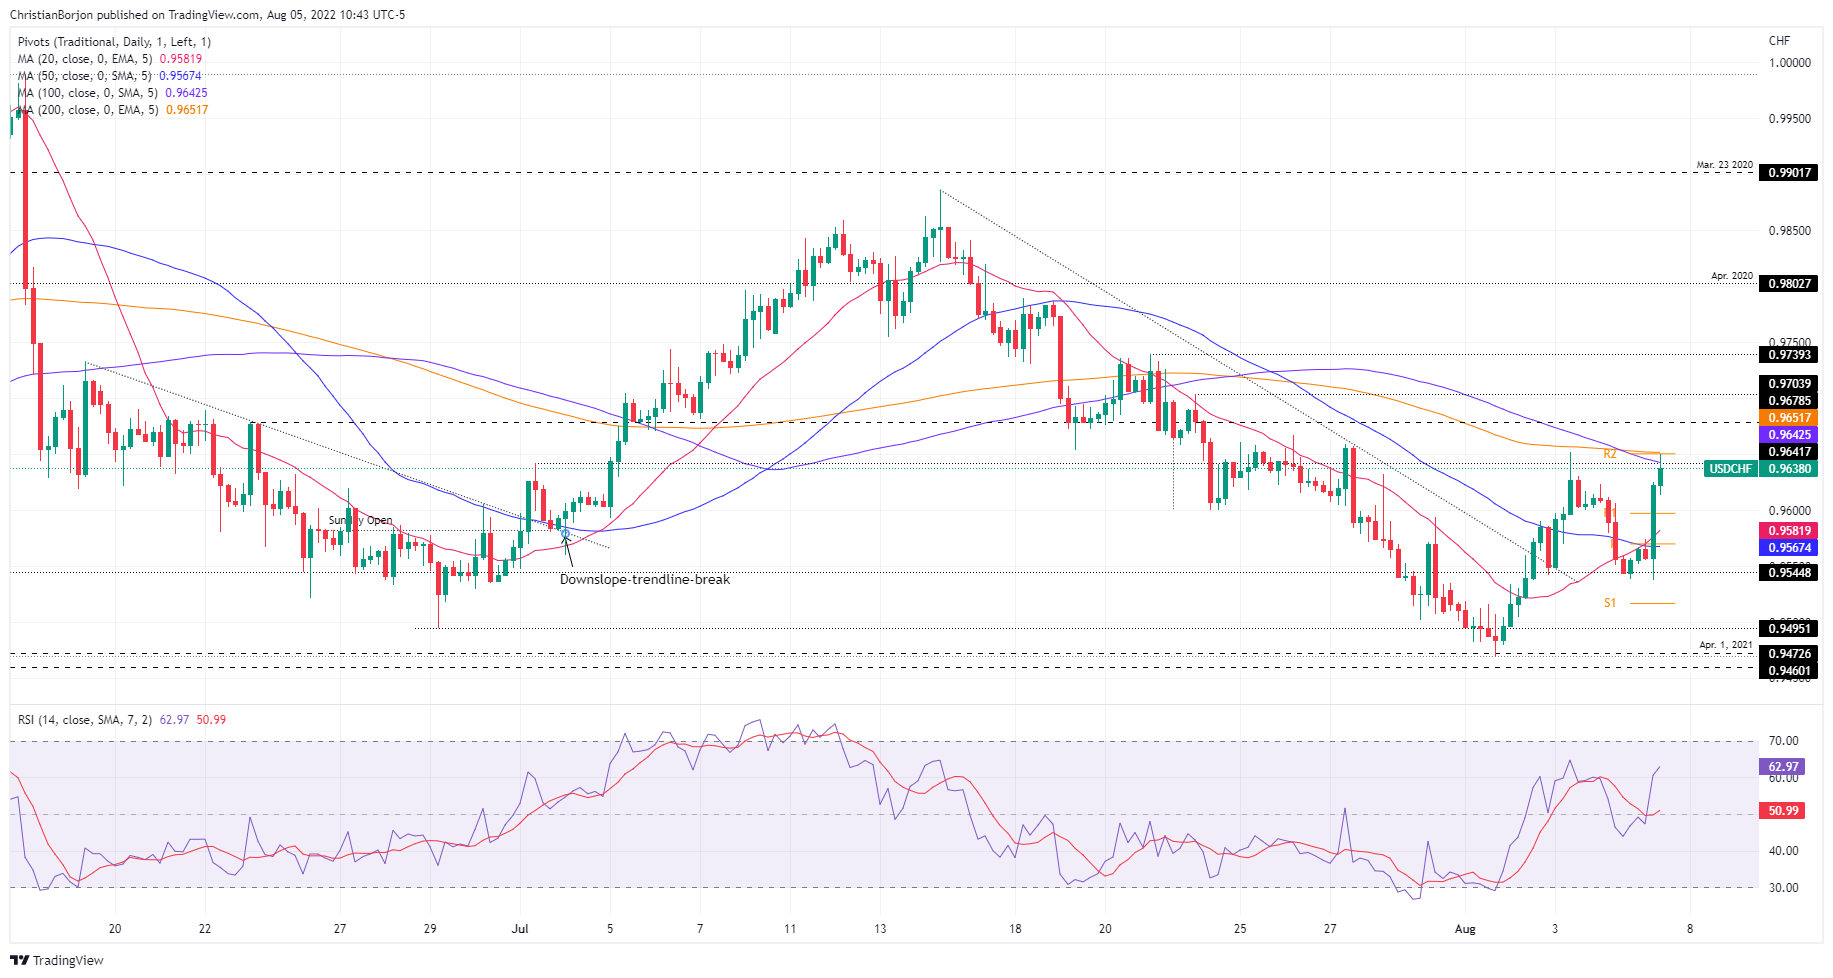
  • If USD/CHF buyers conquer 0.9642-50, a move towards 0.9703 is on the cards.

The USD/CHF is surging during the North American session after hitting a daily low early in the Asian session at 0.9538. Still, positive US economic data spurred a jump towards the daily high at 0.9644, shy of the weekly high at 0.9651. At the time of writing, the USD/CHF is trading at 0.9638.

USDCHF Price Analysis: Technical outlook

The USD/CHF daily chart illustrates the pair as upward biased, further reinforced by the Relative Strength Index, crossing above the 50-midline, displaying that buyers are gathering momentum as the exchange rate approaches a substantial resistance area at the confluence of the 20 and 50-day EMAs, in the 0.9660-75. A decisive break would clear the way towards the July 14 daily high at 0.9886.
In the 4-hour scale, the USD/CHF tests the confluence of the 100, 200-EMAs and the R2 daily pivot point, in the 0.9642-52 area, which ounce cleared, could pave the way for the USD/CHF towards the July 22 high at 0.9703. Even though it’s a clouded area, the Relative Strength Index reading at 64 still has some room to spare if buyers step in to push prices higher.

On the other hand, if USD/CHF resistance holds, the major could dip towards the R1 pivot point at 0.9600.
USDCHF Key Technical Level

USD/CHF

Overview
Today last price0.9638
Today Daily Change0.0075
Today Daily Change %0.79
Today daily open0.955
 
Trends
Daily SMA200.9672
Daily SMA500.9679
Daily SMA1000.9622
Daily SMA2000.9421
 
Levels
Previous Daily High0.9623
Previous Daily Low0.9544
Previous Weekly High0.9668
Previous Weekly Low0.9502
Previous Monthly High0.9886
Previous Monthly Low0.9502
Daily Fibonacci 38.2%0.9574
Daily Fibonacci 61.8%0.9593
Daily Pivot Point S10.9522
Daily Pivot Point S20.9493
Daily Pivot Point S30.9442
Daily Pivot Point R10.9601
Daily Pivot Point R20.9651
Daily Pivot Point R30.968

Author

Christian Borjon Valencia

Markets analyst, news editor, and trading instructor with over 14 years of experience across FX, commodities, US equity indices, and global macro markets.


More from Christian Borjon Valencia
Share:

Editor's Picks

GBP/USD clings to multi-day peaks below 1.3500

GBP/USD trades with marked gains on Friday, now giving away some gains following an earlier surpass of the key 1.3500 yardstick. Indeed, Cable gathers fresh steam amid the strong offered stance in the Greenback, all after US NFP badly missed expectations in July.

EUR/USD: Post-NFP bounce falters around 1.1580

EUR/USD reverses Thursday’s decline and trades with solid gains in the 1.1560 region, or two-month peaks, on Friday. The pair’s firm performance comes in a context of a sharp correction in the US Dollar as investors continue to assess disheartening US NFP readings.

How Wall Street rigs the game [Video]

In this week’s Live from the Vault, Andrew Maguire is joined by Peter Antico and Sean Stone to discuss the Paradigm of Money - an in-depth expose of financial market corruption, from naked shorting to the two-tier system that protects Wall Street.

XRP Price Forecast: XRP nears critical $1.00 support
Ripple (XRP) remains pressured on Friday, trading around $1.03 at the time of writing. The token appears to hold this current level as support but lacks a catalyst to sustain a knee-jerk rebound toward the next key resistance at $1.10.
Is Gold about to enter its biggest bull run since 2020?
Gold has stormed back into the spotlight and its next move could leave late buyers chasing. On August 5, the yellow metal surged almost 7% – roughly $174 – to close near $4,308 an ounce, posting one of its biggest daily advances in recent history. A weaker U.S dollar, falling Treasury yields, changing Federal Reserve expectations and renewed safe-haven demand all struck at once.
9-3: Is the Federal Reserve’s vote tally Warsh's new forward guidance?
The rate did not move. Neither did the statement, and that’s the more interesting fact. Set the July 29 Federal Open Market Committee (FOMC) statement beside the one issued on June 17, and the two documents are identical apart from a single verb and a paragraph at the bottom naming three dissenters.