|

USD/CHF Price Analysis: Slips below 0.9100 as bearish harami pattern emerges

  • USD/CHF forms a bearish harami pattern, reversing from resistance at 0.9120 to exchange around 0.9050.
  • Despite a bullish RSI, the uptrend wanes due to strong resistance from the 100-day EMA and poor US economic data.
  • The risk of a daily close below the 20-day EMA at 0.9058 poses a potential challenge to the 0.9000 mark.

USD/CHF pares some of its Wednesday’s gains, forming a bearish harami two candlestick pattern at a juncture with resistance at around the 0.9120 area, capping the advance of the major. Therefore, USD/CHF retreated below 0.9100 and exchanges hands around the 0.9050 area.

USD/CHF Price Analysis: Technical outlook

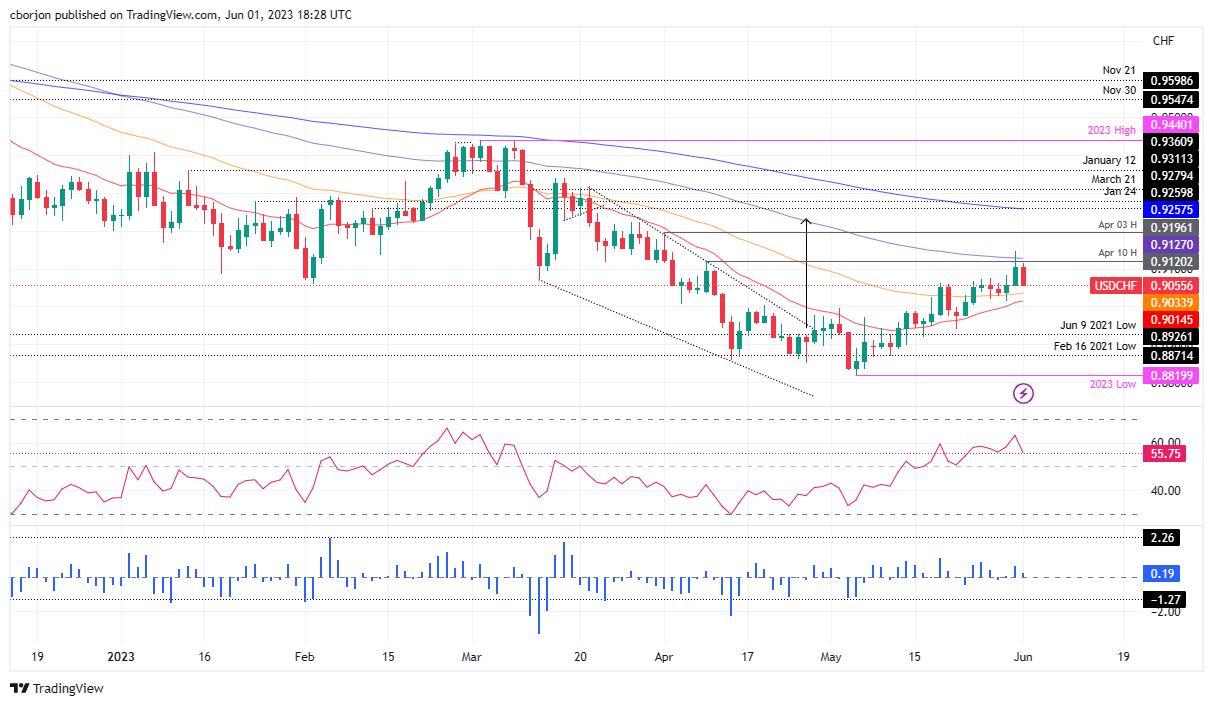
Since the beginning of the week, the USD/CHF meandered on top of the 50-day Exponential Moving Average (EMA) at 09034, which, acting as dynamic support, buyers saw it as a zone to open new positions, as the USD/CHF hit a fresh two-month high at around 0.9147. Nonetheless, the uptrend faded, as strong resistance emerged in the form of the 100-day EMA at 0.9127, alongside April 10 daily high at 0.9120.

Hence, bad US economic data was seen as an excuse for sellers to step in and drag the USD/CHF toward the lows of the day at 0.9054, below the 20-day EMA at 0.9058. In the outcome of a daily close below the latter, the next stop would be the 50-day EMA At 0.9034 before challenging the 0.9000 figure.

Even though price action remains neutral, in the short term, a pullback is likely. But traders should know that the Relative Strength Index (RSI) indicator is bullish, so upside risks remain.

USD/CHF Price Action – Daily chart

USD/CHF Daily chart

USD/CHF

Overview
Today last price0.9056
Today Daily Change-0.0050
Today Daily Change %-0.55
Today daily open0.9106
 
Trends
Daily SMA200.8985
Daily SMA500.9005
Daily SMA1000.9131
Daily SMA2000.9381
 
Levels
Previous Daily High0.9148
Previous Daily Low0.9056
Previous Weekly High0.9075
Previous Weekly Low0.8941
Previous Monthly High0.9148
Previous Monthly Low0.882
Daily Fibonacci 38.2%0.9113
Daily Fibonacci 61.8%0.9091
Daily Pivot Point S10.9059
Daily Pivot Point S20.9011
Daily Pivot Point S30.8967
Daily Pivot Point R10.9151
Daily Pivot Point R20.9195
Daily Pivot Point R30.9243

Author

Christian Borjon Valencia

Markets analyst, news editor, and trading instructor with over 14 years of experience across FX, commodities, US equity indices, and global macro markets.

More from Christian Borjon Valencia
Share:

Editor's Picks

GBP/USD clings to daily gains near 1.3350

GBP/USD holds just in positive territory around 1.3350 on Friday as the Greenback keeps a vacillating price action. With Fed rate hike expectations easing and US markets closed for the Independence Day holiday, Cable remains on track to post solid weekly gains.

EUR/USD remains sidelined around 1.1440

EUR/USD holds on to its recent gains and consolidates around 1.1440 at the end of the week as the US Dollar lacks clear direction. In the meantime, trading conditions remain subdued, with volatility constrained by the closure of US markets for the Independence Day holiday.

Gold flirts with two-week highs, targets $4,200

Gold extends its recovery for a third straight day, advancing toward the $4,200 mark per troy ounce on Friday. The precious metal looks set to snap a four-week losing streak as softer-than-expected June US NFP data prompt investors to scale back expectations of further Fed tightening.

Crypto Today: Bitcoin, Ethereum, XRP advance amid renewed capital inflows

Bitcoin maintains its upward momentum, holding above the $61,000 mark at the time of writing on Friday. Major altcoins such as Ethereum and Ripple are also posting gains, signaling a modest uptick in market sentiment and renewed risk appetite among investors.

The Iran war failed to trigger a recession. Can the US economy keep defying expectations?

Nearly four months after the start of the Iran war, the US economy remains remarkably resilient. While the conflict initially triggered a severe disruption to global energy markets and a sharp rise in Oil prices, recent diplomatic progress between Washington and Tehran has eased concerns about a prolonged supply shock.

Kevin Warsh offers no policy clues: Why markets still got their answer

Financial markets came to Sintra looking for clues about the Federal Reserve's (Fed) next move. They largely left with confirmation that Fed Chair Kevin Warsh intends to make those clues much harder to find.