|

USD/CHF Price Analysis: Sellers stepped at the 100-DMA, eyeing to crack 0.9470

  • The USD/CHF tumbling below the 100-day EMA could pave the way for a re-test of 0.9470.
  • In the near term, the USD/CHF is neutral downwards, and once it clears 0.9550, it could open the door toward 0.9500.

The USD/CHF retraces under the 100-day EMA and shifts the pair’s bias to neutral-downwards as the exchange rate further separates from the previously mentioned moving average (MA) and closes to the August 3 daily low at 0.9542. At the time of writing, the USD/CHF is trading at 0.9655.

USD/CHF Price Analysis: Technical outlook

From a daily chart perspective, the USD/CHF is neutral-to-downward biased reinforced for several reasons. Firstly, the exchange rate is below the 20, 50, and 100-DMAs. Secondly, the Relative Strength Index (RSI) is in negative territory, made a U-turn, from aiming higher, now is headed downwards, narrowing the distance with its 7-day RSI’s MA. Once the RSI crosses under the latter, it confirms the bearish bias.

Therefore, the USD/HF path of least resistance is downwards. The major’s first support would be 0.9542. Once broken, it will expose the 0.9500, followed by the August 2 low at 0.9470.

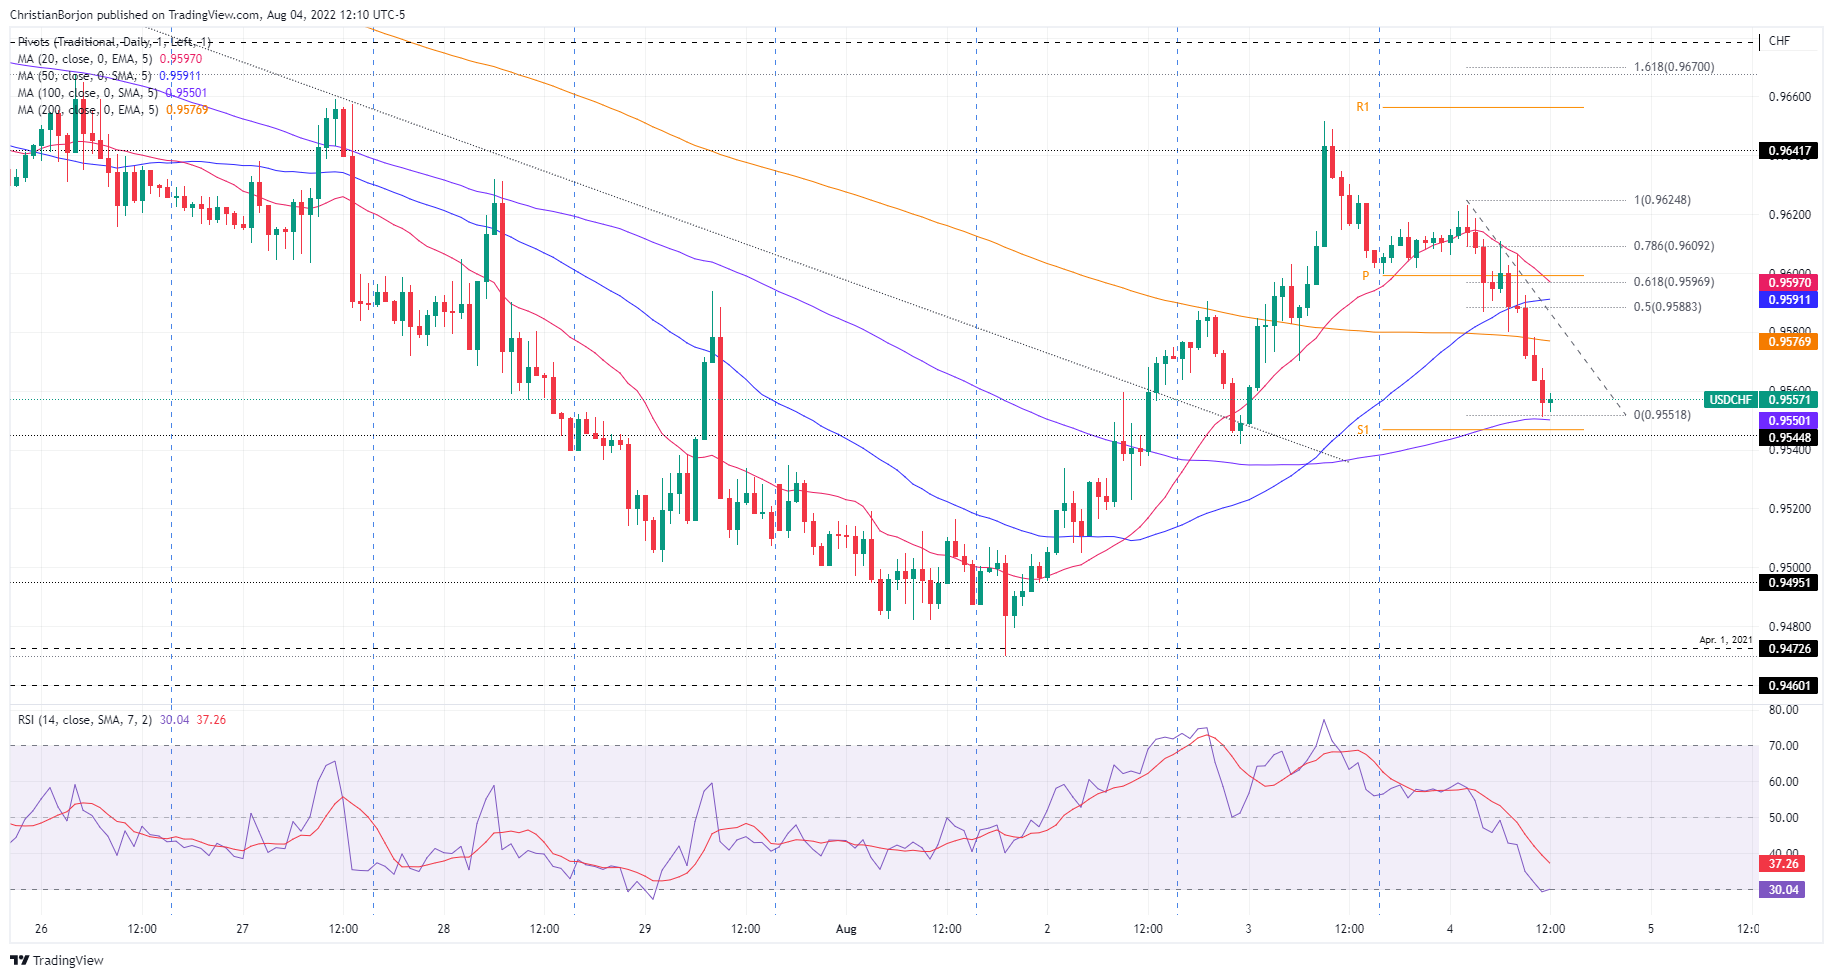
USD/CHF Hourly chart

The USD/CHF hourly chart illustrates the pair as neutral-to-downward biased. However, the confluence of the S1 daily pivot and the 100-hour EMA around 0.9550 stopped the downtrend at the time of typing. Nevertheless, USD/CHF traders should notice that the Relative Strength Index (RSI) exited from oversold conditions, with its slope aiming higher, so a correction might be on the cards. Therefore, the USD/CHF might aim toward Fibonacci’s 50% retracement at 0.9588 before cracking 0.9550. Once cleared, the major’s next support will be the August 1 daily low at 0.9470.

USD/CHF Key Technical Levels

USD/CHF

Overview
Today last price0.9557
Today Daily Change-0.0049
Today Daily Change %-0.51
Today daily open0.9606
 
Trends
Daily SMA200.9681
Daily SMA500.9679
Daily SMA1000.962
Daily SMA2000.9419
 
Levels
Previous Daily High0.9652
Previous Daily Low0.9542
Previous Weekly High0.9668
Previous Weekly Low0.9502
Previous Monthly High0.9886
Previous Monthly Low0.9502
Daily Fibonacci 38.2%0.961
Daily Fibonacci 61.8%0.9584
Daily Pivot Point S10.9548
Daily Pivot Point S20.9491
Daily Pivot Point S30.9439
Daily Pivot Point R10.9657
Daily Pivot Point R20.9709
Daily Pivot Point R30.9767

Author

Christian Borjon Valencia

Markets analyst, news editor, and trading instructor with over 14 years of experience across FX, commodities, US equity indices, and global macro markets.

More from Christian Borjon Valencia
Share:

Editor's Picks

GBP/USD resumes downside below 1.3200

GBP/USD resumes its downside below 1.3200 in European trading on Wednesday. The pair remains vulnerable amid a broadly firmer US Dollar and chaotic UK political environment. The focus is now on BoE-speak for further trading impetus.

EUR/USD sits at yearly low near 1.1350 on USD strength

EUR/USD sits at yearly lows near 1.1350 in the European morning on Wednesday. The pair remains vulnerable to further declines amid a bullish US Dollar. The Greenback continues to draw support from hawkish Fed bets and US-Iran peace deal uncertainty.

Gold: Bears retain control as Fed rate hike bets continue to boost USD

Gold recovers slightly from a nearly two-week low, around the $4,050 region, touched earlier this Wednesday. The commodity, however, sticks to its bearish bias for the second straight day, and seems vulnerable to weaken further amid sustained US Dollar buying.

Dogecoin tests a key make-or-break point amid waning retail support

Dogecoin trades below $0.08000 maintaining a steady decline for the seventh straight week. The meme coin is losing its retail strength as DOGE futures Open Interest drops 10% in 24 hours, while institutional demand remains muted with zero inflows so far this week.

Tech rout weighs on US stocks as the USD clocks a fresh 2026 high

Major US equity benchmarks ended Tuesday’s session considerably in the red, with the Nasdaq 100 down 3.3%, the S&P 500 off by 1.4%, and the Dow Jones down 0.1%. Stocks were largely weighed down by tech amid doubts over the AI-driven rally; the Philadelphia Semiconductor Index slid nearly 8%.

Regime change: Inside Kevin Warsh's first move to make the Fed unreadable on purpose

The rate did not move. That was the least interesting thing about Kevin Warsh's first meeting in charge of the Fed. The FOMC held its benchmark at 3.50%-3.75% for the fourth straight meeting, exactly as priced, and then the new chair used his first press conference to dismantle the machinery the market has leaned on for a decade.