USD/CHF Price Analysis: Rising wedge keeps sellers hopeful below 0.9850


  • USD/CHF fades bounce off one-week low inside a bearish chart pattern.
  • Downbeat oscillators add strength to the bearish bias but 0.9850 appears the key support.
  • Buyers need validation from 1.0030 to retake control.

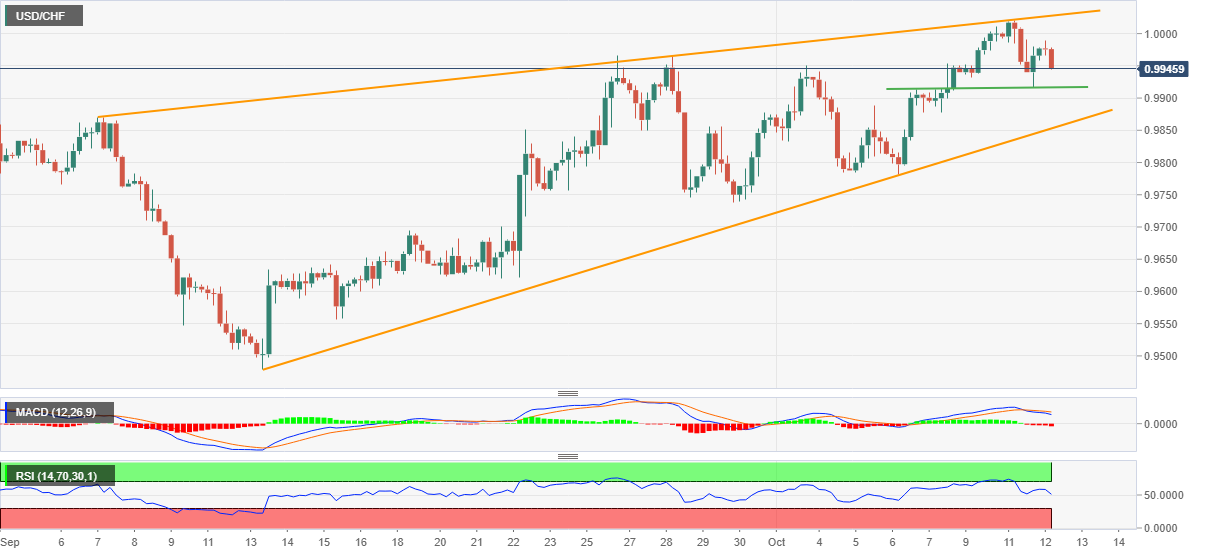
USD/CHF remains pressured after the intraday low, extending the previous day’s pullback from a four-month high to 0.9950 heading into Wednesday’s European session. In doing so, the Swiss currency (CHF) pair stays inside a five-week-old rising wedge bearish chart pattern.

In addition to the quote’s latest weakness and the bearish formation around the multi-day top, the bearish MACD signals and the downbeat RSI (14), not oversold, also favor USD/CHF bears of late.

That said, one-week-old horizontal support near 0.9915 lures the intraday sellers ahead of highlighting the stated wedge’s support line, close to 0.9850 by the press time.

Should the quote remains bearish past 0.9850, a slump to the monthly low of around 0.9780 appears imminent during the theoretical south-run targeting the 0.9310 level.

On the flip side, the upper line of the stated wedge, around 1.0030, restricts short-term USD/CHF upside before directing buyers towards the tops marked in June and May, near 1.0050 and 1.0065 in that order.

If USD/CHF bulls keep the reins past 1.0065, the odds favoring a gradual run-up towards the year 2019 peak surrounding 1.0240 can’t be ruled out.

USD/CHF: Four-hour chart

Trend: Limited downside expected

Additional important levels

Overview
Today last price 0.9948
Today Daily Change -0.0024
Today Daily Change % -0.24%
Today daily open 0.9972
 
Trends
Daily SMA20 0.9802
Daily SMA50 0.9695
Daily SMA100 0.9687
Daily SMA200 0.9539
 
Levels
Previous Daily High 1.0021
Previous Daily Low 0.9916
Previous Weekly High 0.9954
Previous Weekly Low 0.9781
Previous Monthly High 0.9966
Previous Monthly Low 0.948
Daily Fibonacci 38.2% 0.9956
Daily Fibonacci 61.8% 0.9981
Daily Pivot Point S1 0.9919
Daily Pivot Point S2 0.9865
Daily Pivot Point S3 0.9814
Daily Pivot Point R1 1.0024
Daily Pivot Point R2 1.0075
Daily Pivot Point R3 1.0129


Share: Feed news

Information on these pages contains forward-looking statements that involve risks and uncertainties. Markets and instruments profiled on this page are for informational purposes only and should not in any way come across as a recommendation to buy or sell in these assets. You should do your own thorough research before making any investment decisions. FXStreet does not in any way guarantee that this information is free from mistakes, errors, or material misstatements. It also does not guarantee that this information is of a timely nature. Investing in Open Markets involves a great deal of risk, including the loss of all or a portion of your investment, as well as emotional distress. All risks, losses and costs associated with investing, including total loss of principal, are your responsibility. The views and opinions expressed in this article are those of the authors and do not necessarily reflect the official policy or position of FXStreet nor its advertisers. The author will not be held responsible for information that is found at the end of links posted on this page.

If not otherwise explicitly mentioned in the body of the article, at the time of writing, the author has no position in any stock mentioned in this article and no business relationship with any company mentioned. The author has not received compensation for writing this article, other than from FXStreet.

FXStreet and the author do not provide personalized recommendations. The author makes no representations as to the accuracy, completeness, or suitability of this information. FXStreet and the author will not be liable for any errors, omissions or any losses, injuries or damages arising from this information and its display or use. Errors and omissions excepted.

The author and FXStreet are not registered investment advisors and nothing in this article is intended to be investment advice.

Recommended content


Recommended content

Editors’ Picks

GBP/USD stays weak near 1.2400 after UK Retail Sales data

GBP/USD stays weak near 1.2400 after UK Retail Sales data

GBP/USD stays vulnerable near 1.2400 early Friday, sitting at five-month troughs. The UK Retail Sales data came in mixed and added to the weakness in the pair. Risk-aversion on the Middle East escalation keeps the pair on the back foot. 

GBP/USD News

EUR/USD extends its downside below 1.0650 on hawkish Fed remarks

EUR/USD extends its downside below 1.0650 on hawkish Fed remarks

The EUR/USD extends its downside around 1.0640 after retreating from weekly peaks of 1.0690 on Friday. The hawkish comments from Federal Reserve officials provide some support to the US Dollar.

EUR/USD News

Gold: Middle East war fears spark fresh XAU/USD rally, will it sustain?

Gold: Middle East war fears spark fresh XAU/USD rally, will it sustain?

Gold price is trading close to $2,400 early Friday, reversing from a fresh five-day high reached at $2,418 earlier in the Asian session. Despite the pullback, Gold price remains on track to book the fifth weekly gain in a row.

Gold News

Bitcoin Price Outlook: All eyes on BTC as CNN calls halving the ‘World Cup for Bitcoin’

Bitcoin Price Outlook: All eyes on BTC as CNN calls halving the ‘World Cup for Bitcoin’

Bitcoin price remains the focus of traders and investors ahead of the halving, which is an important event expected to kick off the next bull market. Amid conflicting forecasts from analysts, an international media site has lauded the halving and what it means for the industry.   

Read more

Israel vs. Iran: Fear of escalation grips risk markets

Israel vs. Iran: Fear of escalation grips risk markets

Recent reports of an Israeli aerial bombardment targeting a key nuclear facility in central Isfahan have sparked a significant shift out of risk assets and into safe-haven investments. 

Read more

Forex MAJORS

Cryptocurrencies

Signatures