|

USD/CHF Price Analysis: Recovers ground but shy of reclaiming 0.9000

  • USD/CHF rebounds, trading at 0.8941, showing consolidation around the 0.8900 level.
  • The pair needs to surpass 0.8949 (61.8% Fibonacci Retracement) to reach the 0.9000 mark.
  • A drop below 0.8900 could expose the year-to-date low at 0.8819.

USD/CHF rebounds at around weekly lows, though it remains below the 0.9000 figure, due to a risk-off impulse that bolstered the US Dollar (USD), which is set to finish the week with losses of 1.18%, per the US Dollar Index (DXY). The USD/CHF is trading at 0.8941 after hitting a daily low of 0.8901.

USD/CHF Price Analysis:  Technical outlook

The USD/CHF depicts the pair as downward biased, though set to consolidate nearby the 0.8900 figure. During the session, the USD/CHF dropped from around 61.8% Fibonacci Retracement (FR) toward the 78.6% FR level but failed to surpass 0.8900, which would have exacerbated additional losses and a YTD low test of 0.8819.

With the USD/CHF rebounding toward the 61.8% FR at 0.8949, buyers must conquer the latter to lift rates toward the 0.9000 psychological level. In that outcome, the USD/CHF next resistance would be the 50% FR at 0.8983, followed by the 0.9000 mark.

Conversely, the path of least resistance, according to oscillators like the Relative Strength Index (RSI) and the Rate of Change (RoC), If the USD/CHF drops below 0.8900 and beneath the 78.6% FR, would expose the YTD low at 0.8819.

USD/CHF Price Action – Daily chart
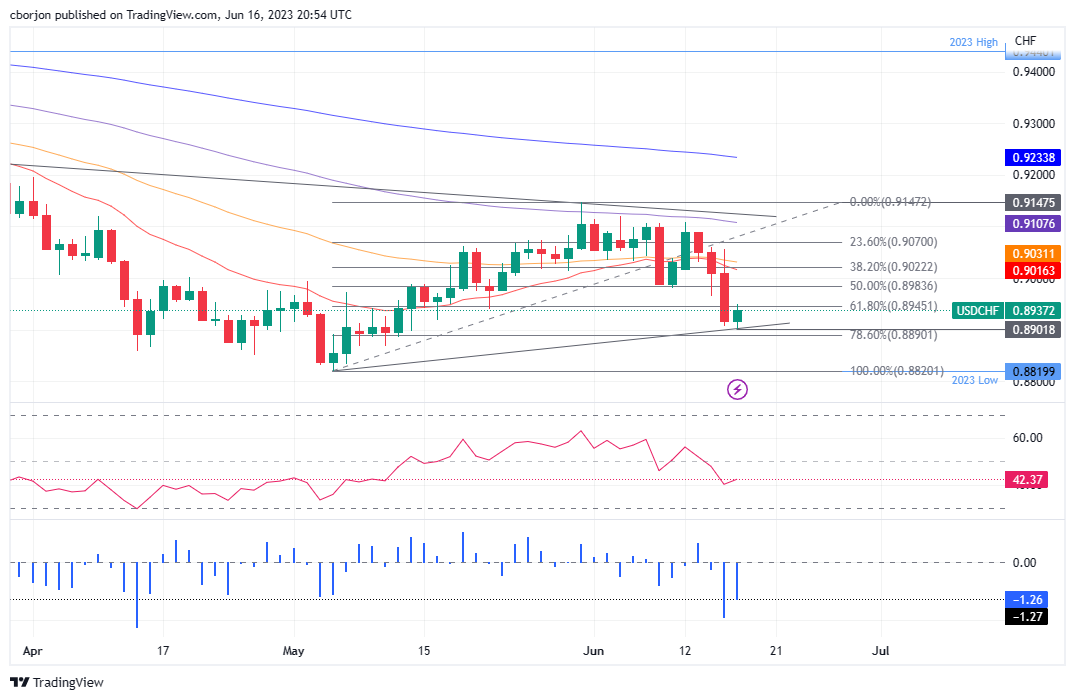
USD/CHF Daily chart

USD/CHF

Overview
Today last price0.894
Today Daily Change0.0021
Today Daily Change %0.24
Today daily open0.8919
 
Trends
Daily SMA200.9042
Daily SMA500.8985
Daily SMA1000.9112
Daily SMA2000.9343
 
Levels
Previous Daily High0.9056
Previous Daily Low0.8907
Previous Weekly High0.912
Previous Weekly Low0.8984
Previous Monthly High0.9148
Previous Monthly Low0.882
Daily Fibonacci 38.2%0.8964
Daily Fibonacci 61.8%0.8999
Daily Pivot Point S10.8865
Daily Pivot Point S20.8812
Daily Pivot Point S30.8716
Daily Pivot Point R10.9014
Daily Pivot Point R20.911
Daily Pivot Point R30.9163
 

Author

Christian Borjon Valencia

Markets analyst, news editor, and trading instructor with over 14 years of experience across FX, commodities, US equity indices, and global macro markets.


More from Christian Borjon Valencia
Share:

Editor's Picks

GBP/USD breaches below 1.3500, two-day lows

GBP/USD faces renewed selling pressure, eroding the earlier advance and slipping back to the sub-1.3500 region on Wednesday. Cable’s loss of upside momentum follows the resurgence of the demand for the Greenback amid steady geopolitical tensions. Looking ahead, the British Pound is expected to remain under scrutiny in light of the release of UK GDP data on Thursday.

EUR/USD weakens to multi-day lows near 1.1520

EUR/USD makes a U-turn and trades with decent losses near 1.1520 following the closing bell on Wall Street on Wednesday. The US Dollar’s recovery post-US CPI data keeps the risk complex under pressure in a context where geopolitics takes centre stage once again. Moving forward, attention remains on US inflation with the release of Producer Prices alongside weekly Claims.

Gold has priced a Fed pause. The hike is still coming
July inflation landed exactly where the consensus had it, on all four lines of the release, and Gold responded by adding around 1% and holding fast near $4,400/ounce, trading at its highest since early June. A print that surprises nobody is not supposed to move a metal that far.
Ethereum Price Forecast: Fidelity plans to add staking to ETH ETF amid yield debate
Asset manager Fidelity has filed with the US Securities and Exchange Commission (SEC) to permit staking in its Ethereum (ETH) exchange-traded fund (ETF), the Fidelity Ethereum Fund (FETH), which holds over $898 million in net assets.
911 million shares freed: Why SpaceX rallied into its own supply

The most heavily trailed supply event of the year landed on August 6, and the SpaceX (SPCX) stock went up. Roughly 911.5 million shares held by insiders and early backers became eligible to trade, around 43% more than the entire float sold at the listing.

Why is Crude Oil priced for a reopening the ships haven't made?
Fourteen vessels crossed the Strait of Hormuz on Tuesday. Before the war, the count ran near 120 a day. In the sessions since the waterway was publicly declared open, Brent has drifted back to $87 and West Texas Intermediate (WTI) to $81, both a little lower again on Wednesday, with daily momentum on each unwound from the top of its range in late July to the low twenties now.