|

USD/CHF Price Analysis: Rebounds from weekly lows and approaches 0.9200

  • USD/CHF gains momentum, signaling a possible bullish trend in coming sessions.
  • Double bottom in the 4-hour chart could pave the USD/CHF way to 0.9300.
  • USD/CHF Price Analysis: Daily close above 0.9220 would confirm the double bottom.

The USD/CHF bounces off weekly lows of 0.9136 and climbs toward testing 0.9200 in the North American session. After hitting a daily high of 0.9226, the USD/CHF is trading at 0.9199, above its opening price.

USD/CHF Price action

Early, the USD/CHF tested last week’s low of 0.9118; since then, it has not looked back. However, as long as the USD/CHF pair achieves a daily close below 0.9200, that would keep the major trading sideways, awaiting a fresh catalyst. On the other hand, the USD/CHF could resume upwards, and it might test the 20 and 50-day EMAs, each at 0.9240 and 0.9272, respectively. Upside risks lie at 0.9300, followed by the 100-day EMA at 0.9343.

Short term, the USD/CHF 4-hour chart portrays a double bottom formed. However, the exchange rate must clear the March 24 high at 0.9216 to confirm its validity. That would pave the way toward the March 21 high of 0.9317, but the pair needs to hurdle some resistance levels on its way north.

The USD/CHF first resistance would be 0.9216. A breach of the latter wand the USD/CHF will face the 100-EMA at 0.9233, followed by the 200-EMA at 0.9255. Once broken, the 0.9300 figure would be up for grabs.

USD/CHF 4-hour chart
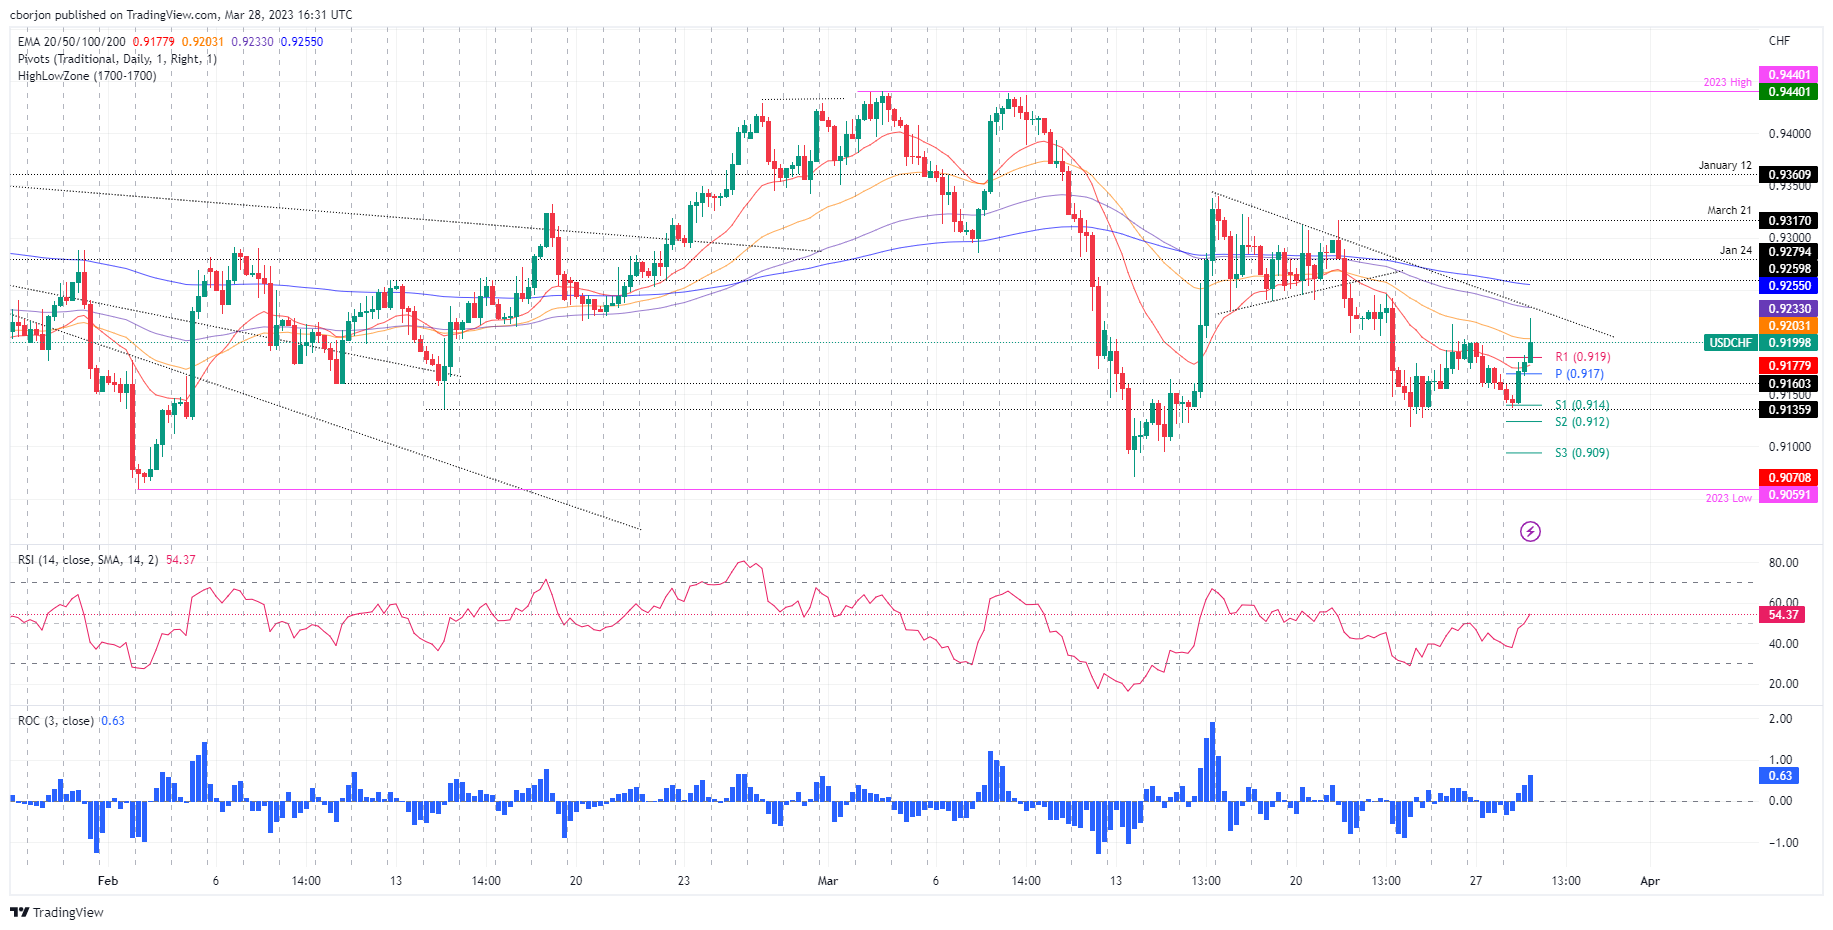
USD/CHF 4-hour chart

USD/CHF Technical levels

USD/CHF

Overview
Today last price0.92
Today Daily Change0.0044
Today Daily Change %0.48
Today daily open0.9156
 
Trends
Daily SMA200.9283
Daily SMA500.9252
Daily SMA1000.9319
Daily SMA2000.9528
 
Levels
Previous Daily High0.92
Previous Daily Low0.9154
Previous Weekly High0.9317
Previous Weekly Low0.912
Previous Monthly High0.9429
Previous Monthly Low0.9059
Daily Fibonacci 38.2%0.9172
Daily Fibonacci 61.8%0.9182
Daily Pivot Point S10.914
Daily Pivot Point S20.9124
Daily Pivot Point S30.9095
Daily Pivot Point R10.9186
Daily Pivot Point R20.9216
Daily Pivot Point R30.9231

Author

Christian Borjon Valencia

Markets analyst, news editor, and trading instructor with over 14 years of experience across FX, commodities, US equity indices, and global macro markets.


More from Christian Borjon Valencia
Share:

Editor's Picks

AUD/USD consolidates above 0.7000; remains close to monthly top

AUD/USD holds steady above 0.7000 during the Asian session on Friday, trading just below the previous day's monthly low amid diverging forces. A hawkish RBA continues to support the Aussie, while the recent decline in US bond yields keeps the US Dollar depressed near a three-week low. However, oil-driven inflation fears reinforce Fed hike bets, which, along with geopolitical risks, could benefit the safe-haven buck and cap the currency pair.

USD/JPY bounces off one-month low; climbs to 157.00 amid reviving USD demand

USD/JPY rebounds from the 156.00 neighborhood, or a one-month low touched during Friday’s Asian session, with bulls looking to extend momentum beyond 157.00 amid the emergence of some US Dollar buying. Meanwhile, Japan's National CPI rose to a nine-month peak and reaffirmed BoJ rate-hike bets, which could support the Japanese Yen and cap gains for the currency pair.

Gold treads water around $4,000

Gold prices maintain its offered stance in place at the end of the week, hovering around the key $4,000 threshold per troy ounce. The persistent selling bias in the precious metal comes amid decent gains in the US Dollar and an acceptable rebound in US Treasury yields across the curve, all alongside further upside traction in crude oil prices.

Crypto Today: Bitcoin holds the 50-day EMA as Ethereum and XRP face structural resistance

Bitcoin gradually ticks up on Friday, trading above $81,000. The Crypto King has recently defended structural support near $80,000, reinforcing the prevailing bullish outlook. Ethereum similarly edges higher above $2,400, while Ripple trades above $1.32 after testing support around $1.30.

The French bond panic is overdone. Here's what the market is misreading 

France's 10-year government bond yield has climbed above 5%, reigniting fears of a sovereign debt crisis in the Eurozone. With public debt exceeding €3.5 trillion, persistent budget deficits and a fragmented political landscape, investors are increasingly questioning the French government's ability to stabilize its finances.

What November 3 means for the Fed's rate path and the US Dollar

The USD faces a decisive period ahead of the November 3 midterm elections. While markets anticipate another interest rate increase from the Fed in December, the battle for control of Congress could reshape fiscal policy expectations and, indirectly, the path of US monetary policy in 2027.