|

USD/CHF Price Analysis: Reaches another fresh two-year-high, shy of the 0.9800 mark

  • The USD/CHF rallied for the eight-straight session, up by some 3.50%.
  • A dismal market mood boosted the greenback, with the US Dollar Index meandering around 103.600.
  • USD/CHF Price Forecast: Despite RSI at overbought territory, it remains to trend higher, but it could be subject to a mean reversion move.

The USD/CHF edges higher during the North American session as the New York session winds down for the first time in May and is trading at around 0.9779, shy of two-year-highs, gaining some 0.47%.

Wall Street is set to record losses on May’s first trading day, courtesy of a dismal sentiment. US Treasury yields are soaring, with 5s, 7s, and 20s above the 3% threshold, underpinning the greenback. The US Dollar Index, a gauge of the buck’s value against a basket of six rivals, edges higher, up some 0.37%, sitting at 103.600.

On Monday, in the overnight session, the USD/CHF opened near the daily pivot at 0.9710, though some pips above the 50-hour simple moving average (SMA), lying around the aforementioned area. Nonetheless, around the mid-European session, the USD/CHF managed to rally towards fresh two-year-highs at 0.9789, some pips shy of the 0.9800 mark, around the R2 daily pivot.

USD/CHF Price Forecast: Technical outlook

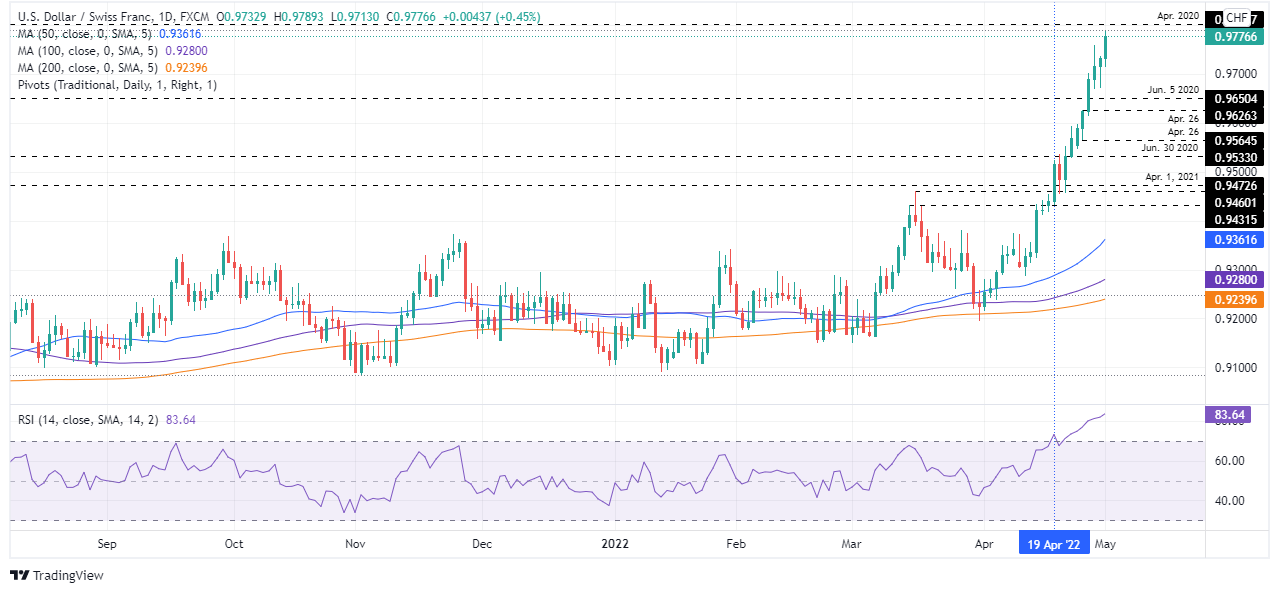
The USD/CHF daily chart shows the pair remains in a steep uptrend and has just one day of losses, compared to eight days of gains once it broke above the 0.9500 mark. Oscillators already show the pair as overbought, as the Relative Strength Index (RSI) at 83.00 illustrates. However, it remains with an upslope, a signal that the USD/CHF might keep trending higher before posting a reversal.

With that said, the USD/CHF first resistance would be April’s 2020 swing high at 0.9802. Break above would expose 0.9850, followed by 0.9901, March 23, 2020, daily high.

USD/CHF

Overview
Today last price0.9779
Today Daily Change0.0044
Today Daily Change %0.45
Today daily open0.9735
 
Trends
Daily SMA200.9466
Daily SMA500.9352
Daily SMA1000.9278
Daily SMA2000.924
 
Levels
Previous Daily High0.9736
Previous Daily Low0.9671
Previous Weekly High0.9759
Previous Weekly Low0.9547
Previous Monthly High0.9759
Previous Monthly Low0.9221
Daily Fibonacci 38.2%0.9712
Daily Fibonacci 61.8%0.9696
Daily Pivot Point S10.9692
Daily Pivot Point S20.9649
Daily Pivot Point S30.9627
Daily Pivot Point R10.9757
Daily Pivot Point R20.978
Daily Pivot Point R30.9823

Author

Christian Borjon Valencia

Christian Borjon began his career as a retail trader in 2010, mainly focused on technical analysis and strategies around it. He started as a swing trader, as he used to work in another industry unrelated to the financial markets.

More from Christian Borjon Valencia
Share:

Markets move fast. We move first.

Orange Juice Newsletter brings you expert driven insights - not headlines. Every day on your inbox.

By subscribing you agree to our Terms and conditions.

Editor's Picks

EUR/USD flat lines below mid-1.1600s; bulls await move beyond 50-day SMA amid weaker USD

The EUR/USD pair is seen oscillating in a narrow range during the Asian session on Friday and consolidating its recent strong gains to an over two-week high, touched the previous day. Spot prices currently trade around the 1.1635 area, nearly unchanged for the day and below the 50-day Simple Moving Average pivotal barrier.

GBP/USD slips near 1.3150 as UK government drops plans to raise tax rates

GBP/USD retraces its recent gains from the previous session, trading around 1.3150 during the Asian hours on Friday. The pair depreciates as the Pound Sterling declines amid rising concerns over fiscal discipline and political stability in the United Kingdom.

Gold buyers return with safe-haven flows, eyes weekly gain

Gold revisits the $4,200 level early Friday after a sharp pullback, eyes weekly gains. US Dollar consolidates weekly losses amid data disruption and reduced December Fed rate cut bets. Gold remains a ‘buy-on-pullbacks’ trade amid a four-hourly bullish technical setup.

Bitcoin, Ethereum and Ripple flash deeper downside risks as market selloff intensifies

Bitcoin, Ethereum and Ripple trade in red on Friday after correcting more than 5%, 10% and 2%, respectively, so far this week. BTC has slipped below the $100,000 key level, while ETH and XRP have faced rejection at their resistance levels, signaling that bears remain firmly in control and that a deeper correction may be underway.

How soon is the BoJ likely to resume interest rate hikes?

The Bank of Japan once again finds itself walking a tightrope between political pressure, economic data, and market expectations. With interest rates still anchored at 0.5%, speculation is growing over when Governor Ueda will pull the trigger on the next hike.

Ripple advances as whales step up accumulation amid renewed risk-on sentiment

Ripple (XRP) is trading slightly below $2.50 at the time of writing on Thursday, after marking an intraday high at $2.52 buoyed by positive sentiment in the broader cryptocurrency market.