|

USD/CHF Price Analysis: Gains but falls short of parity at around 0.9960s

  • The USD/CHF consolidates around 0.9930s, up 0.47% in the day as traders prepare to attack the parity.
  • Elevated US Treasury yields and a risk-off mood boost the greenback.
  • USD/CHF Price Forecast: Negative divergence between RSI and price action might open the door for a dip towards 0.9700.

The USD/CHF retreated from YTD highs around 0.9960s as traders got ready to launch an assault toward the parity, but a negative market mood and USD traders booking profits were the main reason that kept the USD/CHF around the 0.9900 mark. At the time of writing, the USD/CHF is trading at 0.9932.

Monday’s main theme has been higher US Treasury yields, as the 10-year benchmark note struck a four-year high in the last week, though as of writing sits at 3.075%. Furthermore, China’s exports slowed to single digits, the weakest in almost two years, as tighter and wider coronavirus curbs halted factory production and hurt domestic demand, adding to broader economic woes.

On Monday, the USD/CHF opened in the Asian session below the 0.9900 mark, but market sentiment increased appetite for the greenback, which pushed above the R2 daily pivot at 0.9930, just shy of the R3 pivot point at around 0.9970.

USD/CHF Price Forecast: Technical outlook

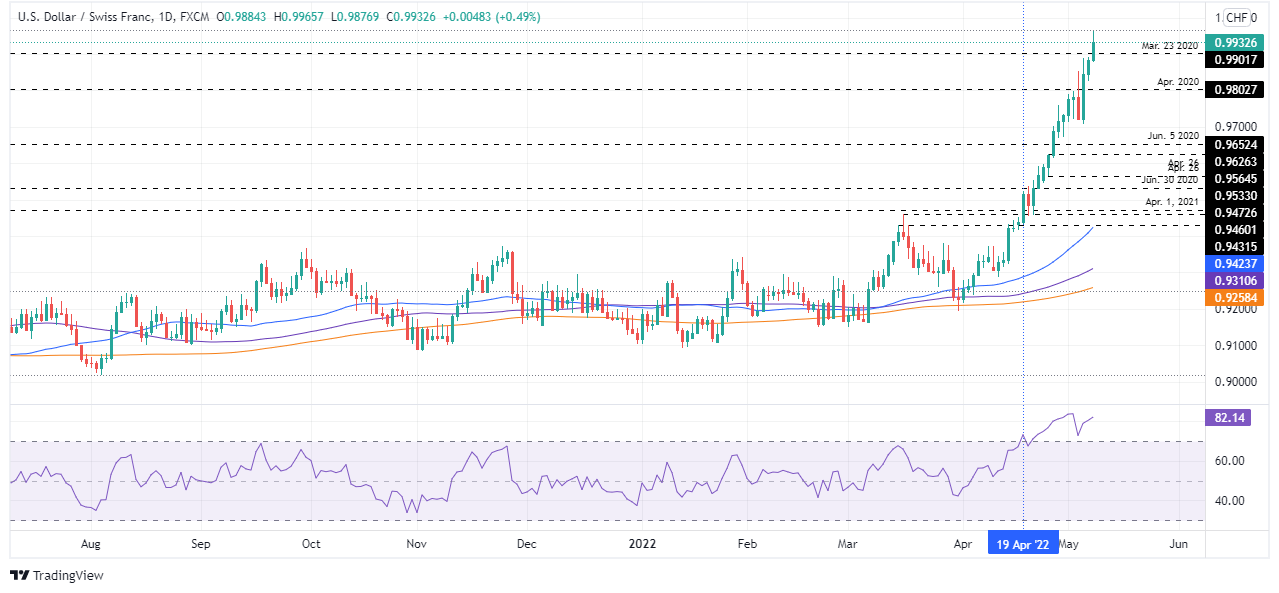
The USD/CHF daily chart maintains the pair as upward biased, though USD/CHF traders taking profits caused a slight dip toward 0.9930s. The Relative Strength Index (RSI), around 82.29, aims slightly down, which could eventually confirm a negative divergence between RSI and price action.

The USD/CHF first support would be 0.9900. Break below would expose essential demand levels, like April 2020 swing high at around 0.9802, followed by 0.9700. Upwards, the major’s first resistance would be, May 9 daily high at 0.9965. A breach of the latter would expose the parity.

USD/CHF

Overview
Today last price0.9932
Today Daily Change0.0050
Today Daily Change %0.51
Today daily open0.9886
 
Trends
Daily SMA200.9589
Daily SMA500.9411
Daily SMA1000.9307
Daily SMA2000.9258
 
Levels
Previous Daily High0.9892
Previous Daily Low0.9827
Previous Weekly High0.9892
Previous Weekly Low0.9707
Previous Monthly High0.9759
Previous Monthly Low0.9221
Daily Fibonacci 38.2%0.9867
Daily Fibonacci 61.8%0.9852
Daily Pivot Point S10.9844
Daily Pivot Point S20.9803
Daily Pivot Point S30.978
Daily Pivot Point R10.991
Daily Pivot Point R20.9933
Daily Pivot Point R30.9975

Author

Christian Borjon Valencia

Markets analyst, news editor, and trading instructor with over 14 years of experience across FX, commodities, US equity indices, and global macro markets.

More from Christian Borjon Valencia
Share:

Editor's Picks

EUR/USD weakens below 1.1900, USD remains firm

EUR/USD has slipped back into its downtrend, drifting below the 1.1900 support as the US Dollar’s recovery keeps gathering traction. Indeed, the Greenback’s push higher gathered pace after President Trump named Kevin Warsh as Jerome Powell’s successor and US Producer Prices rose more than expected in December.

GBP/USD retreats further, threatens 1.3700

Selling pressure remains on the rise, dragging GBP/USD back towards three-day lows around 1.3720-1.3710 at the end of the week. Cable’s retracement reflects a firmer rebound in the Greenback as investors digest Trump’s announcement of the next Fed chair.

Gold remains offered just above $5,000

Gold is extending its pullback, managing to trim part of its strong losses and regain the $5,000 mark and beyond on Friday. The precious metal’s severe drop comes amid broad-based profit-taking across the commodity space, alongside a firmer US Dollar and mixed US Treasury yields.

Stellar deepens correction, slipping to 3-month low as risk-off mood persists

Stellar continues to trade in the red, slipping below $0.20 on Friday, a level not seen since mid-October. Bearish sentiment intensifies amid falling Open Interest and negative funding rates in the derivatives market. On the technical side, weakening momentum indicators support further correction in XLM.

Microsoft sell-off etches $400 billion hole in market, second highest on record

Microsoft's (MSFT) post-earnings cratering on Thursday sent other indices into pullback mode despite the narrow nature of its weakness.

Top 3 Price Prediction: Bitcoin, Ethereum, Ripple deepen sell-off as bears take control of momentum

Bitcoin, Ethereum, and Ripple continued their corrections on Friday, posting weekly losses of nearly 6%, 3%, and 5%, respectively. BTC is nearing the November lows at $80,000, while ETH slips below $2,800 amid increasing downside pressure.