|

USD/CHF Price Analysis: Further upside hinges on 0.8820 breakout, Fed Minutes

  • USD/CHF edges higher past key support confluence as markets await FOMC Minutes.
  • Convergence of 200-SMA, three-week-old rising support line limits immediate downside.
  • Upside RSI (14) suggests further grinding of Swiss Franc pair towards the north.

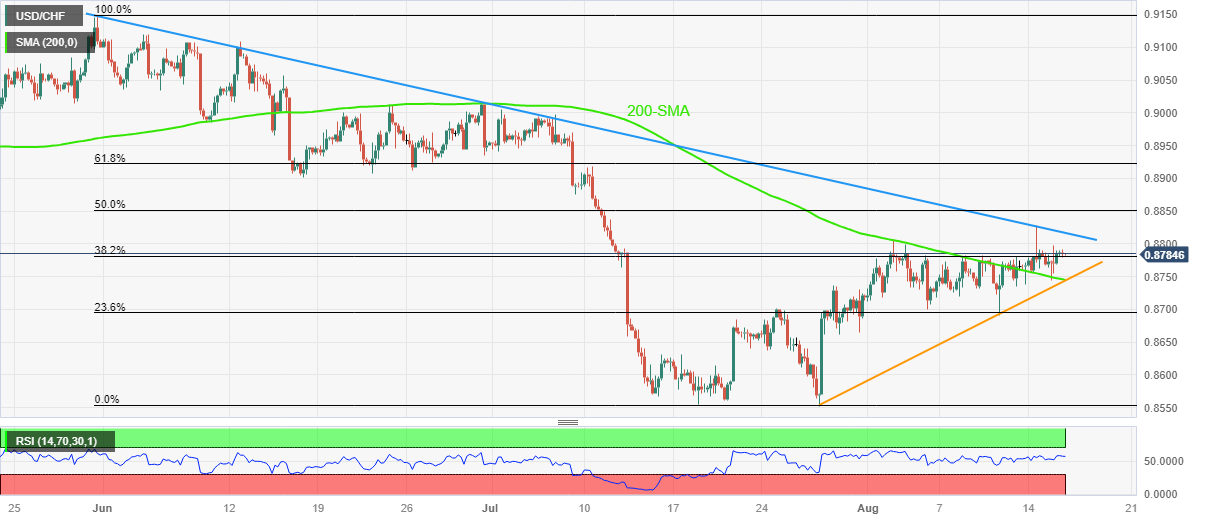
USD/CHF stays defensive around 0.8780 as it struggles to keep the five-week uptrend heading into Wednesday’s European session. That said, the Swiss Franc (CHF) pair’s latest inaction could be linked to the market’s cautious mood ahead of the Federal Open Market Committee’s (FOMC) latest Monetary Policy Meeting Minutes.

Technically, a downward-sloping resistance line from May 31, close to 0.8820 by the press tie, also challenges the USD/CHF buyers even if the quote manages to keep the previous week’s breakout of the 200-SMA. In doing so, the major currency pair also fails to justify the upbeat RSI (14) line, not overbought.

With this, the USD/CHF is likely to portray another attempt in crossing the 0.8820 hurdle, a break of which could propel the prices toward the mid-June swing low of surrounding 0.8900.

However, the 50% and 61.8% Fibonacci retracement of its May-July downside, respectively near 0.5580 and 0.8920, will act as the additional upside filters to watch.

On the contrary, a convergence of the 200-SMA and three-week-long ascending trend line highlights 0.8745 as the short-term key support.

In a case where the Fed Minutes disappoint the US Dollar bulls and drag the USD/CHF price below the 0.8745 support confluence, the odds of witnessing a slump towards the 0.8700 round figure and them to the multi-year low marked the last month around 0.8550 can’t be ruled out.

USD/CHF: Four-hour chart
Trend: Further upside expected

Additional important levels

Overview
Today last price0.8785
Today Daily Change0.0001
Today Daily Change %0.01%
Today daily open0.8784
 
Trends
Daily SMA200.8716
Daily SMA500.8831
Daily SMA1000.8913
Daily SMA2000.9113
 
Levels
Previous Daily High0.8797
Previous Daily Low0.8744
Previous Weekly High0.8783
Previous Weekly Low0.869
Previous Monthly High0.9005
Previous Monthly Low0.8552
Daily Fibonacci 38.2%0.8777
Daily Fibonacci 61.8%0.8764
Daily Pivot Point S10.8754
Daily Pivot Point S20.8723
Daily Pivot Point S30.8701
Daily Pivot Point R10.8806
Daily Pivot Point R20.8827
Daily Pivot Point R30.8858

Author

Anil Panchal

Anil Panchal

FXStreet

Anil Panchal has nearly 15 years of experience in tracking financial markets. With a keen interest in macroeconomics, Anil aptly tracks global news/updates and stays well-informed about the global financial moves and their implications.


More from Anil Panchal
Share:

Editor's Picks

AUD/USD drops to two-week low, further below 0.7000 after RBA's less hawkish rate hike

AUD/USD drifts lower for the second straight day on Tuesday, hitting a fresh two-week low during the Asian session after the Reserve Bank of Australia's (RBA) widely expected 25 bps rate hike. The decision was far from unanimous, with three members preferring to hold rates at 4.60%. This tempers expectations of further tightening, which, along with modest US Dollar strength, weighs on the currency pair.


USD/JPY fails near 159.00 amid weak USD, intervention risks

USD/JPY edges lower during Tuesday’s Asian session, reversing part of the previous day's gains to 158.00 as the US Dollar remains depressed amid hopes for Iran diplomacy and ahead of US midterm elections. Meanwhile, intervention risks support the Japanese Yen, though the uncertainty over the timing of the next BoJ rate hike caps gains. This keeps the pair confined within a familiar range and warrants caution before placing directional bets.


Gold holds Monday’s gains near $3,950 on US-Iran deal hopes

Gold clings to previous day’s recovery around $3,945 in the Asian trade on Tuesday, as hopes of a deal between the United States and Iran have kept oil prices under pressure. Still, the Gold price is close to its yearly low of $3,870.23 posted on Friday.

XRP and XLM slide as bearish signal grows
Ripple (XRP) and Stellar (XLM) remain under pressure on Tuesday, with bearish momentum capping recovery attempts. XRP trades around $1.25 as sellers maintain control, while XLM extends its decline below $0.162, raising the risk of a deeper correction. Meanwhile, mixed derivatives data, bearish on-chain metrics and weakening technical indicators all hint at continued downside risk for both altcoins.
What a split Congress means for the US Dollar

The United States is going to the polls on Tuesday, and much is at stake. The mid-term elections mean the renovation of roughly one-third of the Senate and all 435 of the House seats. Additionally, special elections in Florida and Ohio will be held to fill the seats vacated by US Secretary of State Marco Rubio and Vice President JD Vance.

The 2% inflation target came from a throwaway remark. It now moves trillions
The Federal Reserve's 2% inflation goal grew out of an off-the-cuff remark by a New Zealand politician in 1988. Bond investors still price long-term US debt as if 2% holds, so a change in how the Fed measures inflation would move markets.