|

USD/CHF Price Analysis: Fades bounce off 61.8% Fibo. below 0.9600

  • USD/CHF fails to extend the corrective pullback from two-month low.
  • Bearish MACD signals, sustained break of previously key support line favor sellers.
  • 21-EMA adds strength 0.9690 hurdle, 100-EMA offers immediate support.

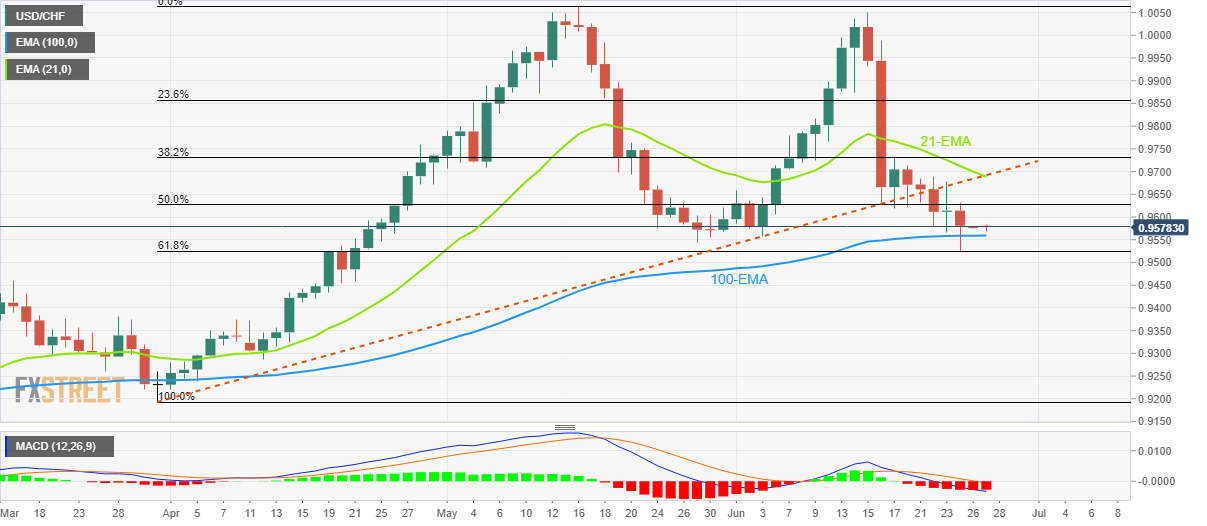
USD/CHF remains pressured around 0.9580, after declining for the last two weeks, as it fades bounce off the 61.8% Fibonacci retracement level of April-May upside. In doing so, the Swiss currency (CHF) pair eyes to refresh the two-month low during Monday’s initial Asian session.

Not only the failures to rebound but the bearish MACD signals and successful trading below the support-turned-resistance line from late March also keep sellers hopeful.

That said, the 100-EMA level of 0.9560 appears to restrict the short-term USD/CHF downside ahead of the aforementioned key Fibonacci retracement (Fibo.) level near 0.9525.

In a case where the quote drop below 0.9525, March’s high near 0.9460 will be important to watch as a break of which won’t hesitate to direct bears towards refreshing a three-month low, currency around 0.9195.

On the contrary, recovery remains elusive until the quote stays below the confluence of the 21-EMA and the previous support line from March, around 0.9690.

It’s worth noting, however, that the 50% Fibo. near 0.9630 restricts the immediate upside of the USD/CHF pair.

Should the pair rise past 0.9690, the 0.9700 and the 38.2% Fibonacci retracement level around 0.9730 could challenge the upside momentum.

USD/CHF: Daily chart

Trend: Further downside expected

Additional important levels

Overview
Today last price0.9582
Today Daily Change0.0001
Today Daily Change %0.01%
Today daily open0.9581
 
Trends
Daily SMA200.9718
Daily SMA500.9731
Daily SMA1000.9506
Daily SMA2000.9362
 
Levels
Previous Daily High0.9633
Previous Daily Low0.9522
Previous Weekly High0.9713
Previous Weekly Low0.9522
Previous Monthly High1.0064
Previous Monthly Low0.9545
Daily Fibonacci 38.2%0.9564
Daily Fibonacci 61.8%0.959
Daily Pivot Point S10.9524
Daily Pivot Point S20.9467
Daily Pivot Point S30.9413
Daily Pivot Point R10.9635
Daily Pivot Point R20.969
Daily Pivot Point R30.9746

Author

Anil Panchal

Anil Panchal

FXStreet

Anil Panchal has nearly 15 years of experience in tracking financial markets. With a keen interest in macroeconomics, Anil aptly tracks global news/updates and stays well-informed about the global financial moves and their implications.

More from Anil Panchal
Share:

Editor's Picks

EUR/USD seems fragile below 1.1700 as Middle East war boosts energy prices

The EUR/USD pair trades flat at around 1.1680 during the Asian trading session on Tuesday, but broadly seems vulnerable, being close to its five-week low. The major currency pair is under pressure as surging oil prices due to the United States-Israel war with Iran have increased the risks of higher inflation for the Old Continent.

GBP/USD hovers around 1.3400 with bearish pressure intact

GBP/USD edges higher after three days of losses, trading around 1.3400 during the Asian hours on Tuesday. The technical analysis of the daily chart indicates an ongoing bearish bias, as the pair trades within a descending channel pattern.

Gold sticks to gains above $5,350 amid sustained safe-haven demand; firmer USD caps gains

Gold sticks to its positive bias for the third straight day and trades above the $5,350 level heading into the European session on Tuesday. Concerns about a broader regional conflict in the Middle East continue to weigh on investors' sentiment and underpin demand for the traditional safe-haven bullion.

Stellar risks deeper losses as derivatives metrics turn negative

Stellar is trading red below $0.16 at the time of writing on Tuesday, after a slight recovery the previous day. Weakening derivatives data caps the recovery, while an unfavorable technical outlook projects a deeper correction for the XLM token in the upcoming days.

The market is not panicking it is repricing the probability distribution of Oil and time

At the end of the day, markets do not trade morality or geopolitics. They trade transmission channels. And the only channel that truly matters in this maelstrom runs through the price of energy and the time value of money.

Hyperliquid Price Forecast: HYPE rises on commodities demand amid US-Iran war

Hyperliquid (HYPE) steadies above $33 at press time on Tuesday, marking its fourth consecutive day of recovery in a broadly volatile market due to the ongoing US-Israel strikes on Iran.