|

USD/CHF Price Analysis: Drops to fresh four-week lows and sellers eye the 200-DMA

  • USD/CHF prepares to finish the week with substantial losses of 1.01%.
  • From a daily chart perspective, the USD/CHF shifted to a neutral-downward bias.
  • The USD/CHF hourly chart reinforces the daily bias, as sellers eye a break below 0.9495 on their way to the 200-DMA.

The USD/CHF slides for the fourth straight day out of five in the week, approaching the June 29 cycle low at 0.9495, which, if decisively broken, would pave the way for a USD/CHF fall towards the 200-day EMA at 0.9409. At the time of writing, the USD/CHF is trading at around 0.9517.

USD/CHF Price Analysis: Technical outlook

The USD/CHF daily chart illustrates that the pair has shifted to neutral-to-downward biased. Readings at oscillators, particularly the Relative Strength Index (RSI), is in bearish territory and nowhere near reaching oversold conditions, opening the door for further USD/CHF downward action. Hence, as mentioned above, once the major clear 0.9495, that will open the door to further losses.

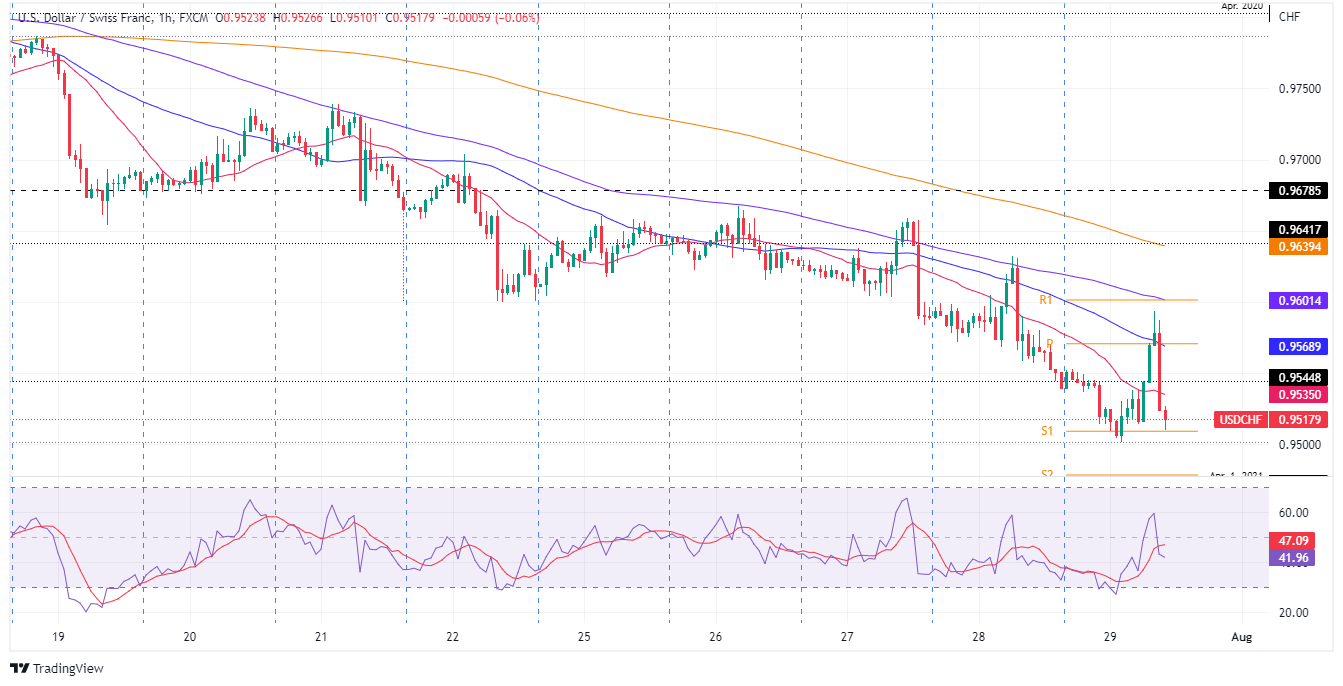
USD/CHF 1-hour chart

In the near term, the USD/CHF hourly chart illustrates that the pair has been seesawing between the daily high and low at 0.9593 and 0.9501, respectively. But once the dust has settled, the exchange rate is at current levels, just above the S1 daily pivot. USD/CHF traders should be aware that in the last couple of hours, the RSI slid below its 7-period SMA, suggesting that downside pressure lies ahead.

Therefore, the USD/CHF bias is downwards, and its first support would be 0.9495. Once cleared, the next support would be the confluence of April 2020 low and the S2 pivot point around 0.9472-80, followed by the S3 daily pivot point at 0.9417.

USD/CHF Key Technical Levels

USD/CHF

Overview
Today last price0.9517
Today Daily Change-0.0040
Today Daily Change %-0.42
Today daily open0.9551
 
Trends
Daily SMA200.9702
Daily SMA500.9688
Daily SMA1000.9614
Daily SMA2000.9412
 
Levels
Previous Daily High0.9632
Previous Daily Low0.9545
Previous Weekly High0.979
Previous Weekly Low0.96
Previous Monthly High1.005
Previous Monthly Low0.9495
Daily Fibonacci 38.2%0.9578
Daily Fibonacci 61.8%0.9599
Daily Pivot Point S10.9519
Daily Pivot Point S20.9488
Daily Pivot Point S30.9432
Daily Pivot Point R10.9607
Daily Pivot Point R20.9664
Daily Pivot Point R30.9695

Author

Christian Borjon Valencia

Markets analyst, news editor, and trading instructor with over 14 years of experience across FX, commodities, US equity indices, and global macro markets.

More from Christian Borjon Valencia
Share:

Editor's Picks

EUR/USD hits fresh 2026 lows near 1.1570

EUR/USD adds to Monday’s heavy losses and reaches new yearly lows around 1.1570 on Tuesday. The pair’s deep pullback comes as the US Dollar extend its strong bounce, always propped up by the intense flight-to-safety environment amid the deteriorating geopolitical landscape in the Middle East.

GBP/USD attacks 1.3300, refreshing three-month lows

GBP/USD is deep in the red near 1.3300, accelerating its downside to renew three-month lows in European trading on Tuesday. The ongoing escalation in the Iran war, combined with rising Oil prices, weighs negatively on the higher-yielding Pound Sterling as the US Dollar capitalizes on increased haven demand.

Gold meets buyers around $5,000, remains under pressure

Gold comes under renewed and marked selling pressure on Tuesday, dangerously approaching the critical $5,000 mark per troy ounce, reversing at the same time four consecutive daily advances. The yellow metal’s bearish tone comes on the back of the increasing demand for the Greenback and investors’ repricing of Fed rate cuts.

Crypto Today: Bitcoin, Ethereum, XRP pull back as sentiment remains in extreme market fear

The cryptocurrency market is broadly in the red on Tuesday as the Middle East grapples with an escalating war. Bitcoin (BTC) is in a pullback, trading below $67,000 at the time of writing, and most altcoins follow suit.

Energy shock 2.0: Why rising Gas prices could hit the Euro

Even without a confirmed, sustained disruption, the mere risk to a key global energy chokepoint is enough to inject a significant premium into European Gas markets. And for the Euro, that matters.

Ripple falters amid sell-off jitters and negative funding rates

Ripple (XRP) has come under pressure, drifting lower to $1.35 at the time of writing on Tuesday. The over 2% correction looks poised to erase the previous day’s gains, which lifted the remittance token to $1.42.