USD/CHF Price Analysis: Consolidates above 0.8800
- USD/CHF trades in a narrow range, slightly above 0.8800, as US markets will remain closed on Monday.
- The week, the USD Index will be guided by the release of FOMC minutes.
- The SNB may commence the rate-cut cycle sooner amid easing price pressures.

The USD/CHF pair is struck in a tight range around 0.8800 in the London session on Monday. The Swiss Franc asset struggles for a direction as US markets will remain closed on Monday because of Presidents’ Day. Therefore, lower trading activity is anticipated.
The US Dollar Index (DXY) has discovered an intermediate support near 104.20 after declining for three trading sessions in a row. The USD Index fails to find a cushion despite investors seeing the Federal Reserve (Fed) keeping interest rates unchanged in the range of 5.25-5.50% till the June meeting due to persistent inflationary pressures.
This week, the Federal Open Market Committee (FOMC) minutes for the January policy meeting will guide the US Dollar. The FOMC minutes will provide a fresh outlook on interest rates.
Meanwhile, the Swiss franc is expected to face pressure in the longer term as investors see the Swiss National Bank (SNB) leading the rate cut cycle due to a sharp slowdown in the consumer price inflation data. Price pressures in the Swiss economy have remained below the 2% target, allowing the SNB to start reducing interest rates after holding them higher for longer.
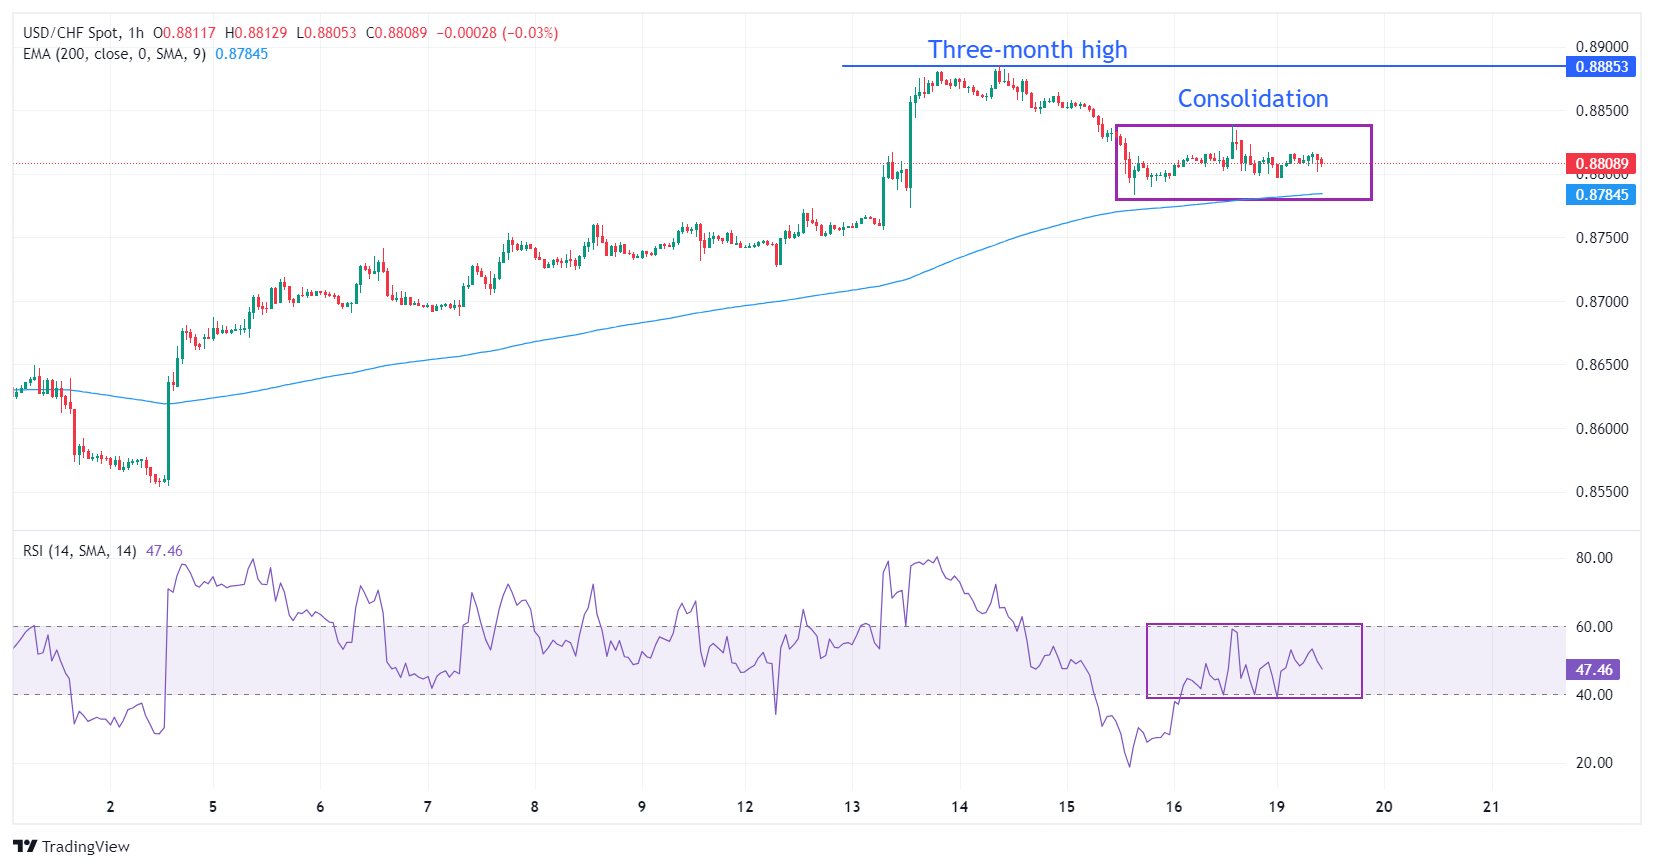
USD/CHF trades sideways in a narrow range of 0.8795-0.8838 on an hourly scale. A sideways trend indicates a volatility contraction, followed by a decisive move in either direction. The 200-period Exponential Moving Average (EMA) near 0.8786 continues to support the US Dollar bulls.
The 14-period Relative Strength Index (RSI) oscillates in the 40.00-60.00 range, which indicates indecisiveness among market participants.
Fresh upside would emerge if the asset breaks above the three-month high of around 0.8886, which would unlock upside towards the September 20 low at 0.8932 and the November 8 low at 0.8976.
On the contrary, a breakdown below February 15 low at 0.8783 would expose the asset to February 13 low at 0.8746, followed by the round-level support of 0.8700.
USD/CHF hourly chart
Author

Sagar Dua
FXStreet
Sagar Dua is associated with the financial markets from his college days. Along with pursuing post-graduation in Commerce in 2014, he started his markets training with chart analysis.