|

USD/CHF Price Analysis: Climbs near 0.9700 snaping two days of losses

  • The Swiss franc is on the driver's seat, as shown by the USD/CHF dropping 1.82%.
  • Sentiment in the FX space fluctuated, with safe-haven peers gaining, except for the JPY.
  • USD/CHF Price Forecast: Subject for a mean reversion move towards 0.9850.

The USD/CHF recovered some ground after falling to fresh weekly lows around 0.9620, bounced off, and reclaimed 0.9700 on Friday. At the time of writing, the USD/CHF is trading at 0.9695, up by 0.38%.

US equities reflected a positive market mood, but in the FX space, the sentiment was mixed. The greenback staged a recovery, as the US Dollar Index reflected, gaining 0.80%, sitting at 104.631. US Treasury yields fell, though they remained above the 3% threshold.

USD/CHF Price Forecast: Technical outlook

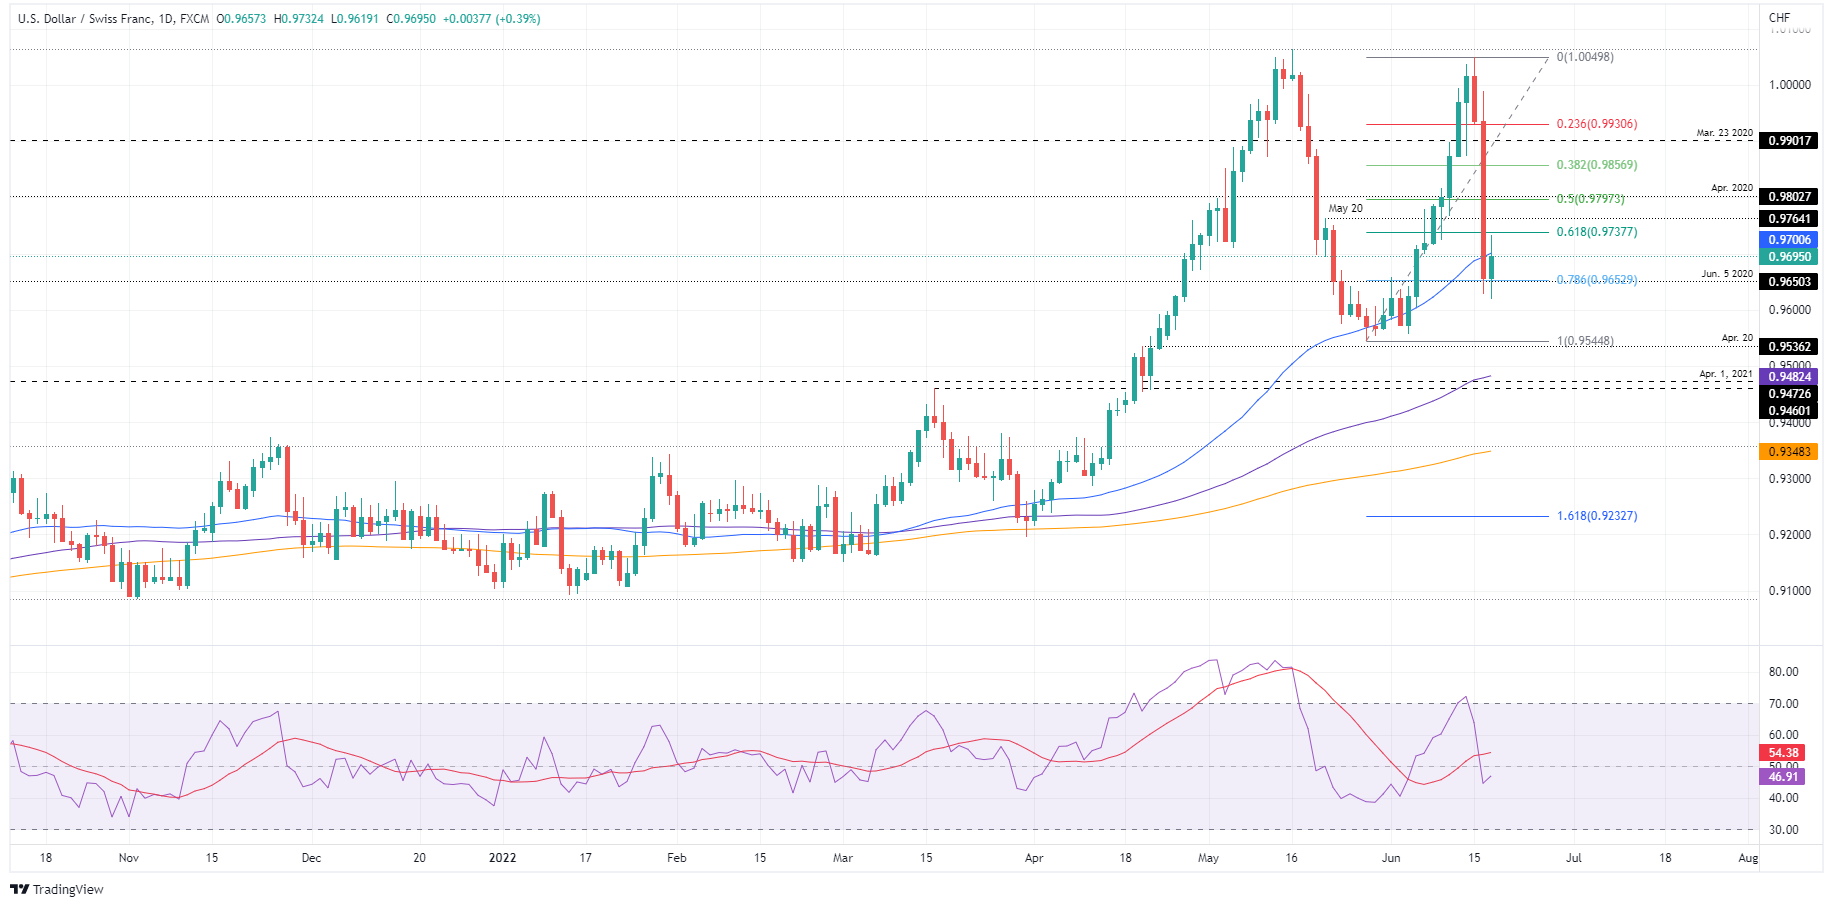
The USD/CHF shifted neutral biased after tumbling 400 pips from the parity, just above the 50-day moving average (DMA) at 0.9700. Reinforcing the aforementioned is the position of the Relative Strength Index (RSI), dropping from overbought conditions, under the 50-midline at 47.40. Nevertheless, due to the size of the fall and the USD/CHF tumbling towards the 78.6% Fibonacci level, that would open the door for a mean reversion move near 50% or the 38.2% Fibonacci retracement.

That said, the USD/CHF first resistance would be the 50-DMA at 0.9700. A breach of the latter would expose the 61.8% Fibonacci retracement at 0.9737. Once broken, that would send the pair towards the 50% Fibo level at 0.9797, followed by a re-test of the 38.2% Fibonacci retracement at 0.9857.

Key Technical Levels

USD/CHF

Overview
Today last price0.9695
Today Daily Change0.0038
Today Daily Change %0.39
Today daily open0.9666
 
Trends
Daily SMA200.9715
Daily SMA500.9698
Daily SMA1000.9482
Daily SMA2000.935
 
Levels
Previous Daily High0.999
Previous Daily Low0.963
Previous Weekly High0.9898
Previous Weekly Low0.9606
Previous Monthly High1.0064
Previous Monthly Low0.9545
Daily Fibonacci 38.2%0.9767
Daily Fibonacci 61.8%0.9852
Daily Pivot Point S10.9534
Daily Pivot Point S20.9402
Daily Pivot Point S30.9174
Daily Pivot Point R10.9894
Daily Pivot Point R21.0121
Daily Pivot Point R31.0253

Author

Christian Borjon Valencia

Markets analyst, news editor, and trading instructor with over 14 years of experience across FX, commodities, US equity indices, and global macro markets.

More from Christian Borjon Valencia
Share:

Editor's Picks

EUR/USD clings to modest gains above 1.1550 post-US CPI

EUR/USD stays in positive territory above 1.1550 in the American session on Wednesday. The data from the US showed that the annual CPI inflation climbed to 4.2% in May. This print came in line with the market expectation and made it difficult for the USD to gather strength.

GBP/USD pulls away from session highs, stays above 1.3400

GBP/USD stays in positive territory slightly above 1.3400 despite pulling away from session highs. The cautious market stance helps the US Dollar limit its losses and cap the pair's upside as investors assess the US inflation data, which showed that the CPI rose 4.2% on a yearly basis in May.

Gold trades at fresh 10-week low below $4,200

Gold builds on Tuesday’s losses and remains under heavy pressure, gyrating around the $4,150 mark per troy ounce as investors evaluate the latest US CPI data on Wednesday. Meanwhile, developments from the Middle East crisis and the likelihood of a more cautious Fed in the next few months continue to weigh on the yellow metal.

Crypto Today: Bitcoin, Ethereum, XRP face downside pressure amid investor de-risking

Major crypto assets trade under intense headwinds on Wednesday, as market participants navigate complex geopolitical and macroeconomic environments.

The market gets a CPI core reprieve, but Oil still holds the match
The market just got a temporary get-out-of-jail-free card, not a full pardon, but enough to keep the Fed’s hand off the rate hike lever as the tape exhales, at least for now. Headline CPI landed exactly where feared, with prices rising 0.5% MoM and 4.2% YoY, the hottest annual inflation print in more than three years and a clear acceleration from 3.8% in April.
The US economy defies the rules: 100 days into the Oil shock and the recession signal is still missing

More than three months after the start of the Iran war and the resulting disruption to global energy markets, the US economy continues to display remarkable resilience. The conflict has triggered a sharp rise in Oil prices, reignited inflationary pressures and fueled widespread concerns about a potential economic slowdown.