USD/CHF Price Analysis: Breaks below 0.9400, eyeing a break beneath the 20/50-DMAs


  • USD/CHF stumbled below the 100-day EMA, eyeing a break below the 20/50-day EMAs.
  • The Relative Strength Index edges down but at the brisk of turning bearish.
  • USD/CHF Price Analysis: Failure to crack the 200-day EMA opened the door for further downside.

The USD/CHF dropped after failing to test the 200-day Exponential Moving Average (EMA), which extended its losses past the 100-day EMA at 0.9383. the USD/CHF, Monday’s high, was 0.9373 before retracing toward the low of 0.9310s. At the time of writing, the USD/CHF is trading at 0.9317, down 0.44% or 40 pips.

USD/CHF Price action

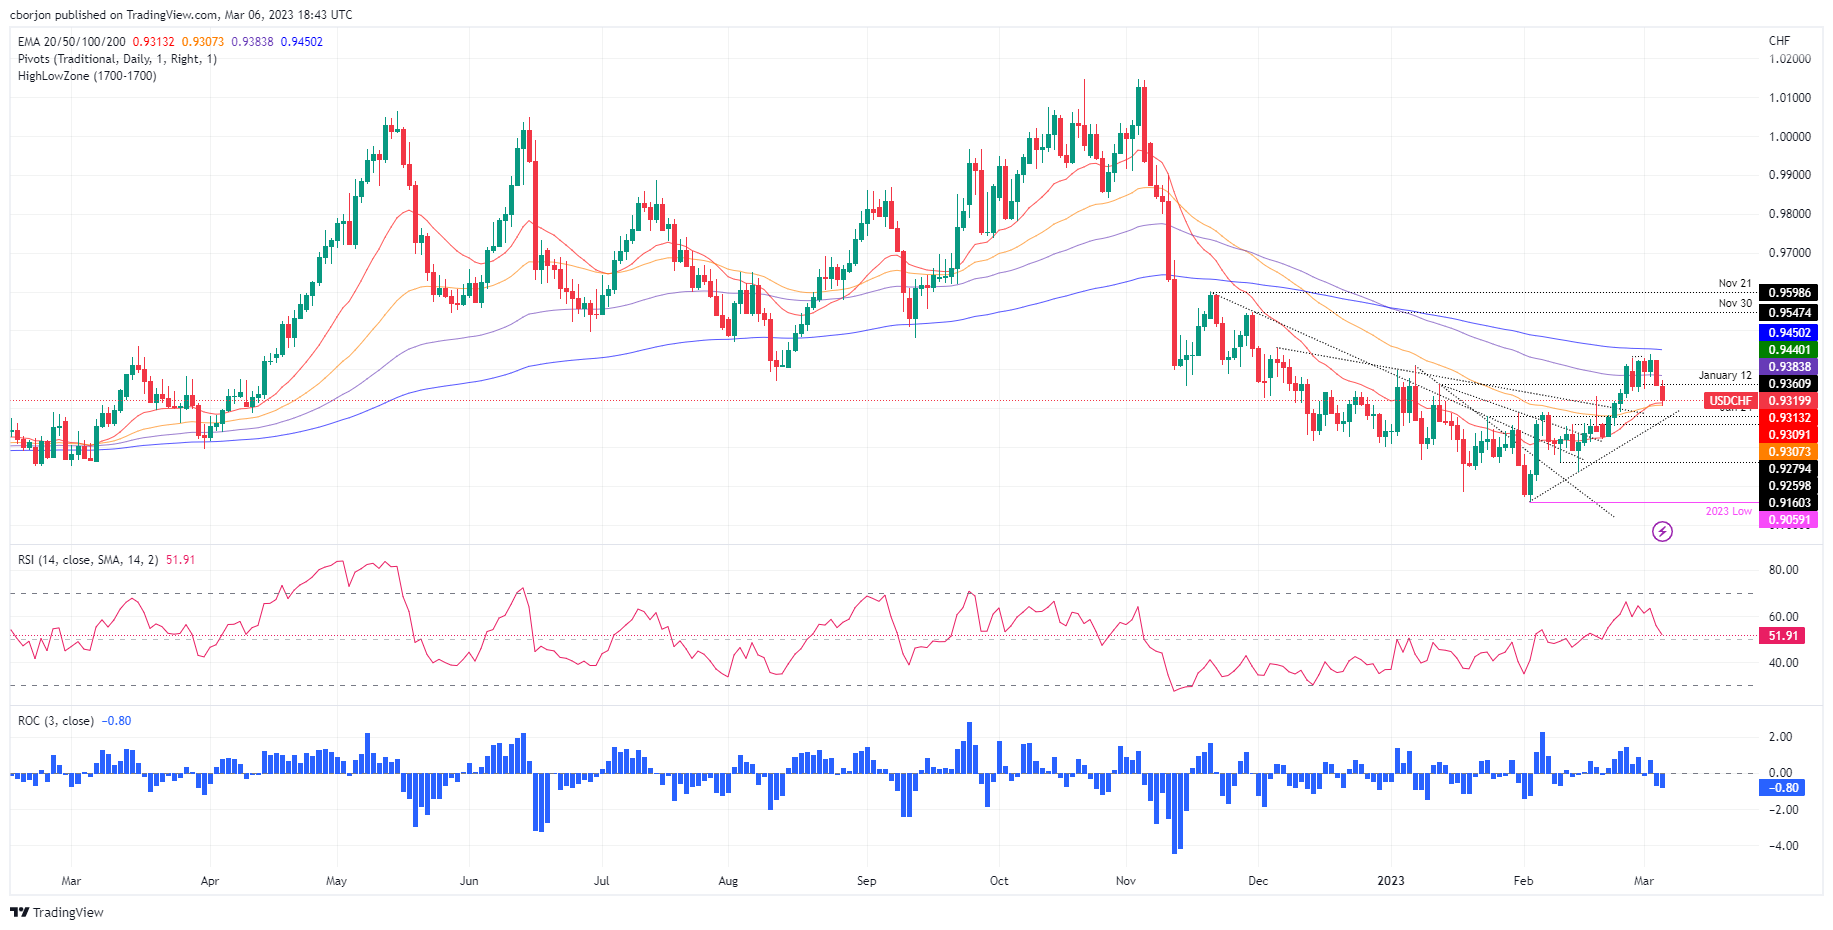
At the beginning of the first full week in March, the USD/CHF keeps a bearish tone but faces solid support at the confluence of moving averages. The 20 and 50-day EMA rest at 0.9313 and 0.9307, respectively, areas that are the first lines of defense for USD/CHF’s bulls. Break below would expose the 0.9300 psychological price level, ahead of a one-month-old upslope support trendline at 0.9270.

Even though the USD/CHF’s bias is bearish, the Relative Strength Index (RSI) remains bullish but aims lower. If the RSI turns bearish, that will exacerbate an acceleration of the downtrend and put into play the YTD low at 0.9059.

As an alternate scenario, the USD/CHF first resistance would be the 100-day EMA at 0.9383. Break above will expose 0.9400, ahead of the important 200-day EMA At 0.9450, ahead of reaching the psychological 0.9500 mark.

USD/CHF Daily chart

USD/CHF Technical levels

USD/CHF

Overview
Today last price 0.9318
Today Daily Change -0.0044
Today Daily Change % -0.47
Today daily open 0.9362
 
Trends
Daily SMA20 0.9292
Daily SMA50 0.9261
Daily SMA100 0.9435
Daily SMA200 0.9567
 
Levels
Previous Daily High 0.9424
Previous Daily Low 0.9359
Previous Weekly High 0.944
Previous Weekly Low 0.9342
Previous Monthly High 0.9429
Previous Monthly Low 0.9059
Daily Fibonacci 38.2% 0.9384
Daily Fibonacci 61.8% 0.9399
Daily Pivot Point S1 0.9339
Daily Pivot Point S2 0.9317
Daily Pivot Point S3 0.9274
Daily Pivot Point R1 0.9404
Daily Pivot Point R2 0.9447
Daily Pivot Point R3 0.947


Share: Feed news

Information on these pages contains forward-looking statements that involve risks and uncertainties. Markets and instruments profiled on this page are for informational purposes only and should not in any way come across as a recommendation to buy or sell in these assets. You should do your own thorough research before making any investment decisions. FXStreet does not in any way guarantee that this information is free from mistakes, errors, or material misstatements. It also does not guarantee that this information is of a timely nature. Investing in Open Markets involves a great deal of risk, including the loss of all or a portion of your investment, as well as emotional distress. All risks, losses and costs associated with investing, including total loss of principal, are your responsibility. The views and opinions expressed in this article are those of the authors and do not necessarily reflect the official policy or position of FXStreet nor its advertisers. The author will not be held responsible for information that is found at the end of links posted on this page.

If not otherwise explicitly mentioned in the body of the article, at the time of writing, the author has no position in any stock mentioned in this article and no business relationship with any company mentioned. The author has not received compensation for writing this article, other than from FXStreet.

FXStreet and the author do not provide personalized recommendations. The author makes no representations as to the accuracy, completeness, or suitability of this information. FXStreet and the author will not be liable for any errors, omissions or any losses, injuries or damages arising from this information and its display or use. Errors and omissions excepted.

The author and FXStreet are not registered investment advisors and nothing in this article is intended to be investment advice.

Recommended content


Recommended content

Editors’ Picks

EUR/USD retreats toward 1.0850 on modest USD recovery

EUR/USD retreats toward 1.0850 on modest USD recovery

EUR/USD stays under modest bearish pressure and trades in negative territory at around 1.0850 after closing modestly lower on Thursday. In the absence of macroeconomic data releases, investors will continue to pay close attention to comments from Federal Reserve officials.

EUR/USD News

GBP/USD holds above 1.2650 following earlier decline

GBP/USD holds above 1.2650 following earlier decline

GBP/USD edges higher after falling to a daily low below 1.2650 in the European session on Friday. The US Dollar holds its ground following the selloff seen after April inflation data and makes it difficult for the pair to extend its rebound. Fed policymakers are scheduled to speak later in the day.

GBP/USD News

Gold climbs to multi-week highs above $2,400

Gold climbs to multi-week highs above $2,400

Gold gathered bullish momentum and touched its highest level in nearly a month above $2,400. Although the benchmark 10-year US yield holds steady at around 4.4%, the cautious market stance supports XAU/USD heading into the weekend.

Gold News

Chainlink social dominance hits six-month peak as LINK extends gains

Chainlink social dominance hits six-month peak as LINK extends gains

Chainlink (LINK) social dominance increased sharply on Friday, exceeding levels seen in the past six months, along with the token’s price rally that started on Wednesday. 

Read more

Week ahead: Flash PMIs, UK and Japan CPIs in focus – RBNZ to hold rates

Week ahead: Flash PMIs, UK and Japan CPIs in focus – RBNZ to hold rates

After cool US CPI, attention shifts to UK and Japanese inflation. Flash PMIs will be watched too amid signs of a rebound in Europe. Fed to stay in the spotlight as plethora of speakers, minutes on tap.

Read more

Forex MAJORS

Cryptocurrencies

Signatures