USD/CHF Price Analysis: Bears await 0.9130 break to tighten grips


Share:
  • USD/CHF stays pressured near intraday low, extends pullback from 50% Fibonacci retracement.
  • Three-month-old horizontal support tests sellers amid downbeat Momentum.
  • 200-day EMA guards immediate upside, monthly high adds to the northside filters.

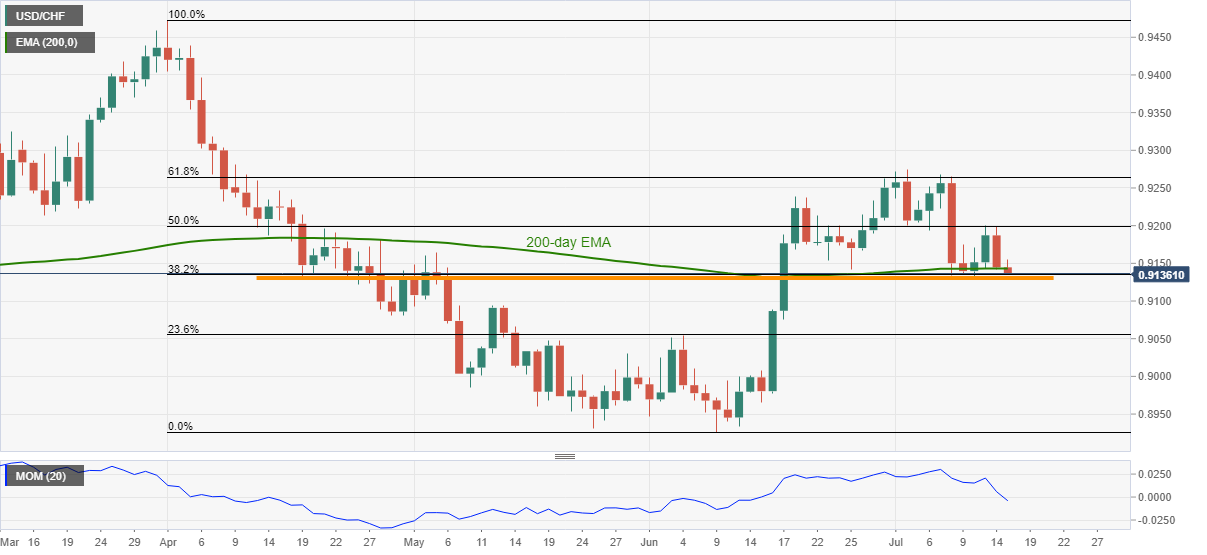
USD/CHF takes offers around 0.9138, refreshes intraday low with 0.07% losses on a day, as European traders await Thursday’s bell.

The major currency pair took a U-turn from 50% Fibonacci retracement level of April–June downside the previous day. However, a horizontal area comprising multiple levels marked since mid-April and 38.2% Fibonacci retracement challenges the bears of late.

Given the downbeat Momentum line, USD/CHF is likely to remain bearish but a daily closing below 0.9130 will bolster the downside momentum.

Following that, May 12 top near 0.9090 and 23.6% Fibonacci retracement level near 0.9055 could please the bear ahead of the yearly bottom surrounding 0.8926.

On the flip side, a daily closing beyond 200-day EMA, around 0.9145, becomes necessary for the pair buyers to bounce back towards a 50% Fibonacci retracement level near 0.9200.

However, the USD/CHF bulls won’t be convinced until the quote stays below 61.8% Fibonacci retracement level of 0.9264.

USD/CHF: Daily chart

Trend: Further weakness expected

Additional important levels

Overview
Today last price 0.9138
Today Daily Change -0.0007
Today Daily Change % -0.08%
Today daily open 0.9145
 
Trends
Daily SMA20 0.9195
Daily SMA50 0.9079
Daily SMA100 0.9161
Daily SMA200 0.9071
 
Levels
Previous Daily High 0.9199
Previous Daily Low 0.9142
Previous Weekly High 0.9268
Previous Weekly Low 0.9133
Previous Monthly High 0.9262
Previous Monthly Low 0.8926
Daily Fibonacci 38.2% 0.9164
Daily Fibonacci 61.8% 0.9177
Daily Pivot Point S1 0.9125
Daily Pivot Point S2 0.9105
Daily Pivot Point S3 0.9068
Daily Pivot Point R1 0.9182
Daily Pivot Point R2 0.9218
Daily Pivot Point R3 0.9238


Share: Feed news

Information on these pages contains forward-looking statements that involve risks and uncertainties. Markets and instruments profiled on this page are for informational purposes only and should not in any way come across as a recommendation to buy or sell in these assets. You should do your own thorough research before making any investment decisions. FXStreet does not in any way guarantee that this information is free from mistakes, errors, or material misstatements. It also does not guarantee that this information is of a timely nature. Investing in Open Markets involves a great deal of risk, including the loss of all or a portion of your investment, as well as emotional distress. All risks, losses and costs associated with investing, including total loss of principal, are your responsibility. The views and opinions expressed in this article are those of the authors and do not necessarily reflect the official policy or position of FXStreet nor its advertisers. The author will not be held responsible for information that is found at the end of links posted on this page.

If not otherwise explicitly mentioned in the body of the article, at the time of writing, the author has no position in any stock mentioned in this article and no business relationship with any company mentioned. The author has not received compensation for writing this article, other than from FXStreet.

FXStreet and the author do not provide personalized recommendations. The author makes no representations as to the accuracy, completeness, or suitability of this information. FXStreet and the author will not be liable for any errors, omissions or any losses, injuries or damages arising from this information and its display or use. Errors and omissions excepted.

The author and FXStreet are not registered investment advisors and nothing in this article is intended to be investment advice.

Follow us on Telegram

Stay updated of all the news

Join Telegram

Recommended content


Follow us on Telegram

Stay updated of all the news

Join Telegram

Recommended content

Editors’ Picks

EUR/USD drops toward 1.0700 after US jobs report

EUR/USD drops toward 1.0700 after US jobs report

EUR/USD came under renewed bearish pressure in the second half of the day on Friday and declined toward 1.0700. Stronger-than-expected Nonfarm Payrolls (NFP) data helps the US Dollar gather strength ahead of the weekend and forces the pair to stay on the back foot.

EUR/USD News

GBP/USD extends slide below 1.2450 amid a stronger USD

GBP/USD extends slide below 1.2450 amid a stronger USD

GBP/USD dropped further and hit fresh daily lows below 1.2450 amid a stronger US dollar. The Greenback remains firm following the release of the US May jobs report. Despite losing almost 100 pips on Friday, GBP/USD is still on track for a weekly gain.

GBP/USD News

Gold falls below $1,960 as US yields rebound after US jobs data

Gold falls below $1,960 as US yields rebound after US jobs data

Gold price turned south and declined below $1,960 on Friday. After the data from the US revealed that Nonfarm Payrolls rose 339,000 in May, the benchmark 10-year US Treasury bond yield gained more than 2% and recovered toward 3.7%, weighing heavily on XAU/USD.

Gold News

China crypto community picks Ethereum, Arbitrum and BNB Chain as top protocols

China crypto community picks Ethereum, Arbitrum and BNB Chain as top protocols

Ethereum, Arbitrum and BNB Chain protocols are top picks for the Chinese crypto community, data from a report shows, a possible bullish catalyst for tokens related to these protocols as Hong Kong opens the door of crypto to retail investors.

Read more

LULU stock adds 15% on big Wall Street beat

LULU stock adds 15% on big Wall Street beat

Lululemon Athletica did it again. In something that has become quite predictable, LULU stock sailed 14.9% higher in Friday’s premarket to $377.20 after the prized athleisure brand posted a nearly 15% earnings beat for the first quarter.

Read more

Forex MAJORS

Cryptocurrencies

Signatures