USD/CHF Price Analysis: Bearish spinning top keeps sellers hopeful
- USD/CHF snaps two-day losing streak.
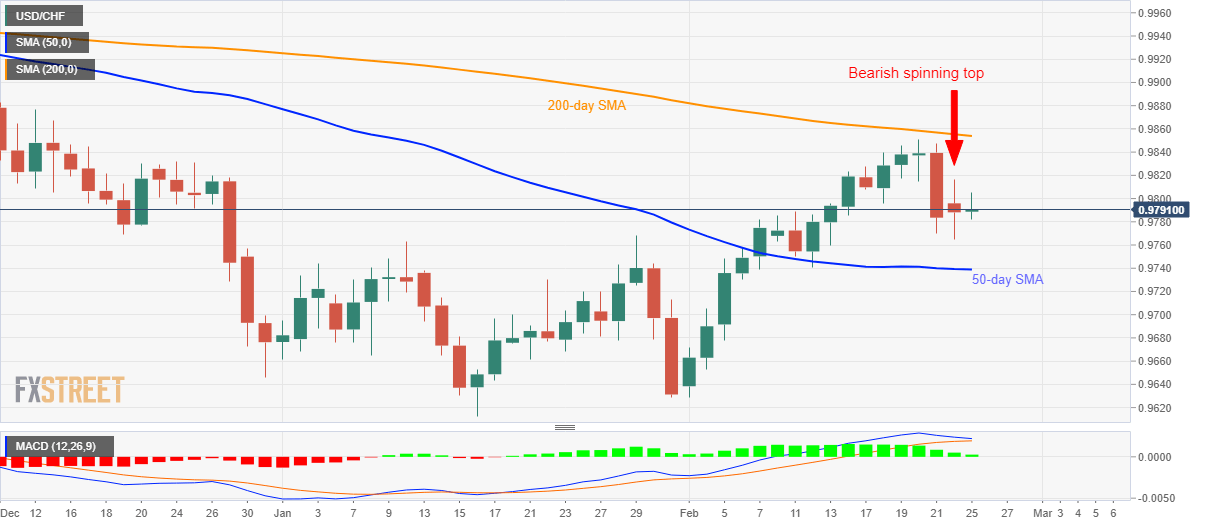
- Bearish candlestick formation, sustained trading below 200-day SMA favor further selling.
- Bullish MACD, 50-day SMA question the bears.
USD/CHF registers fewer moves while trading around 0.9790 during the pre-European session on Tuesday. The daily chart forms a bearish candlestick pattern but bullish MACD and 50-day SMA could limit further declines.
That said, the bears will be more powerful to aim for 0.9700 if breaking a 50-day SMA level of 0.9740 on a daily closing basis.
During the quote’s further declines below 0.9700, the month-start top near 0.9670 and the January month bottom surrounding 0.9612 can offer intermediate halts to 0.9600 round-figure.
Alternatively, the pair’s rise beyond Monday’s top of 0.9816 negates the bearish candlestick formation, which in turn could trigger the quote’s recovery targeting a 200-day SMA level of 0.9854.
USD/CHF daily chart
Trend: Sideways
Author

Anil Panchal
FXStreet
Anil Panchal has nearly 15 years of experience in tracking financial markets. With a keen interest in macroeconomics, Anil aptly tracks global news/updates and stays well-informed about the global financial moves and their implications.


