USD/CHF Price Analysis: 0.9130/35 confluence guards immediate upside
- USD/CHF fails to extend bounces off 0.9072 beyond 0.9086.
- 21-day EMA, a three-week-old falling trend line question the buyers.
- Bullish MACD challenges the bears, the monthly support line becomes the key.
- Q2 Swiss GDP, expected -8.6% versus -2.6% prior will be crucial to watch.
USD/CHF seesaws in a choppy range between 0.9071 and 0.9086, currently around 0.9080, amid the early Thursday’s trading. It should, however, be noted that the pair’s inability to slip past-0.9071 joins bullish MACD to keep buyers hopeful.
While the 0.9100 threshold and 0.9120 may entertain the short-term bulls, a confluence of 21-day EMA and a falling trend line August 03, around 0.9130/35, will be a tough nut to crack.
In a case where the USD/CHF prices manage to cross 0.9135, 0.9200 may offer an intermediate top before highlighting the monthly peak surrounding 0.9240.
On the flip side, the monthly bottom close to 0.9010 will please the sellers if they dominate past-0.9070. Though, a downward sloping trend line from July 31, near 0.8980, could tame further weakness.
Fundamentally, anticipated deterioration in the second-quarter (Q2) GDP for Switzerland could favor the short-term bulls.
USD/CHF daily chart
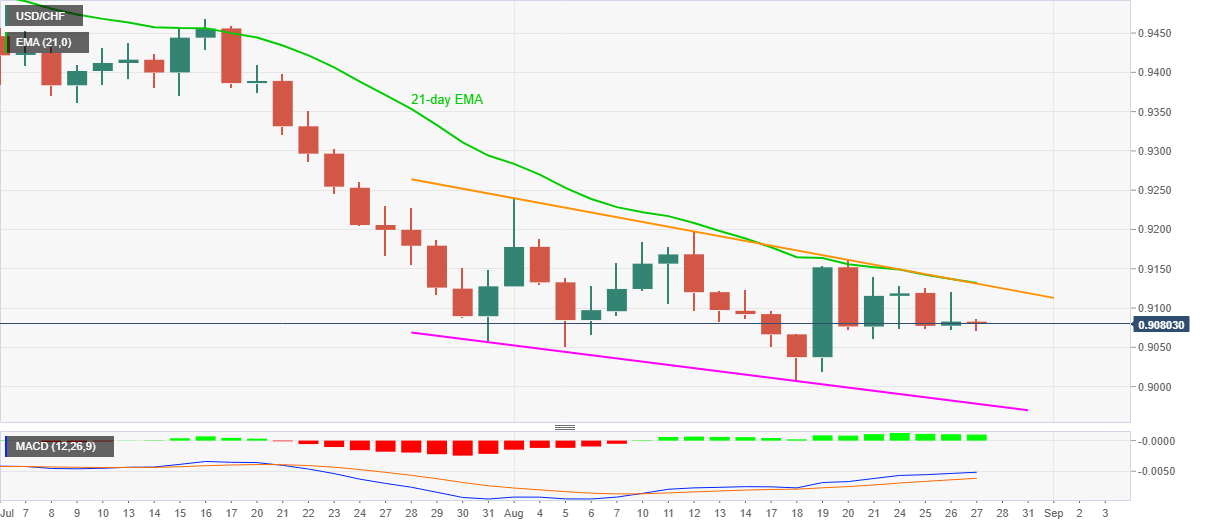
Trend: Bearish
Author

Anil Panchal
FXStreet
Anil Panchal has nearly 15 years of experience in tracking financial markets. With a keen interest in macroeconomics, Anil aptly tracks global news/updates and stays well-informed about the global financial moves and their implications.


