|

USD/CHF Asia Price Forecast: Greenback holds above 0.9700 vs. Swiss franc

  • USD/CHF’s bull trend remains intact as the spot holds above the 0.9700 figure. 
  • The level to beat for bulls is the 0.9800 resistance.


USD/CHF daily chart


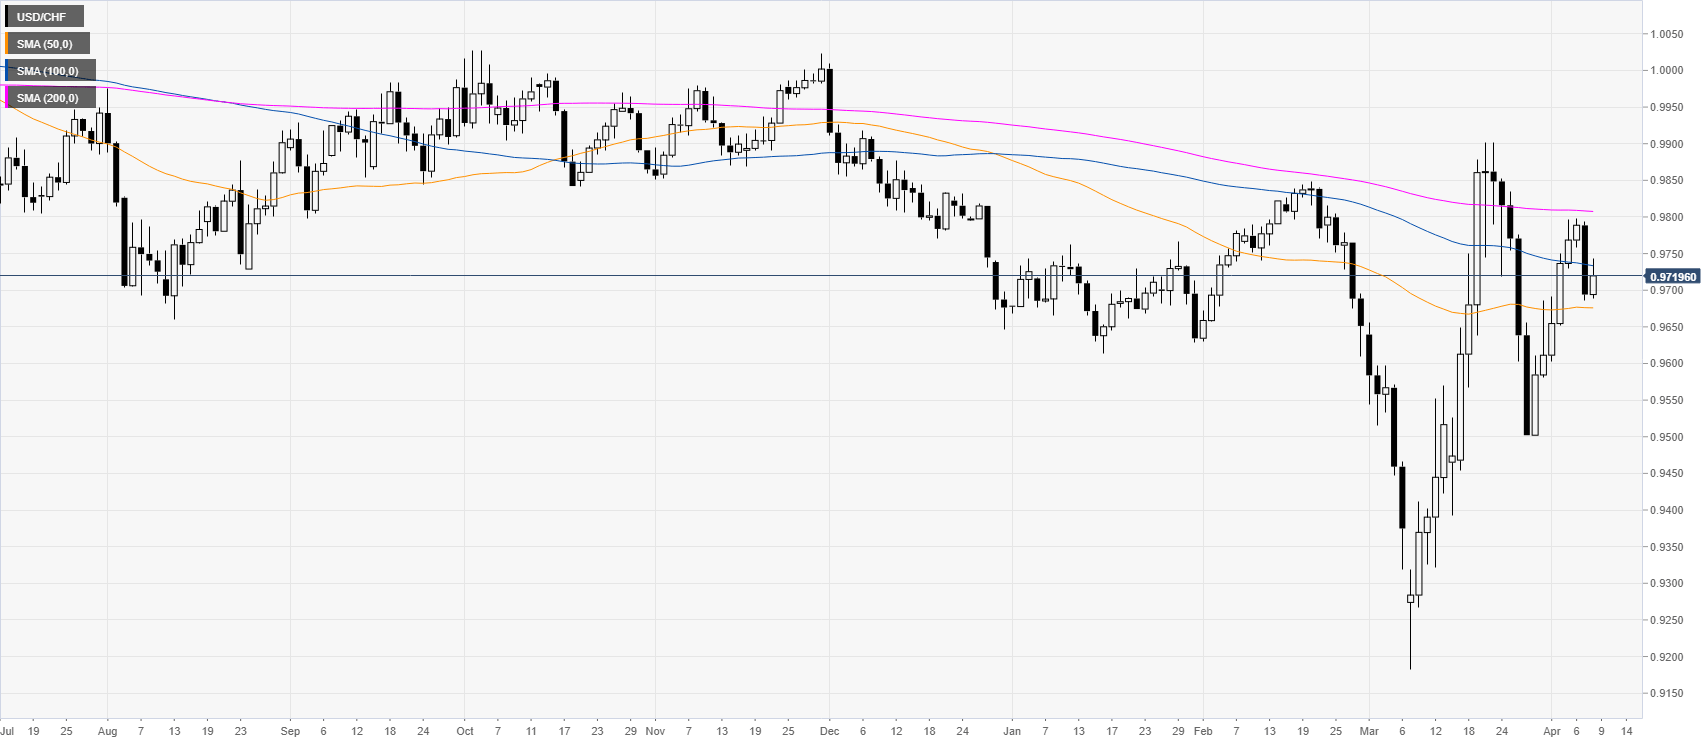
USD/CHF is trading below the 100 and 200 SMA on the daily chart as the market is consolidating the last leg up. 
 

USD/CHF four-hour chart

 
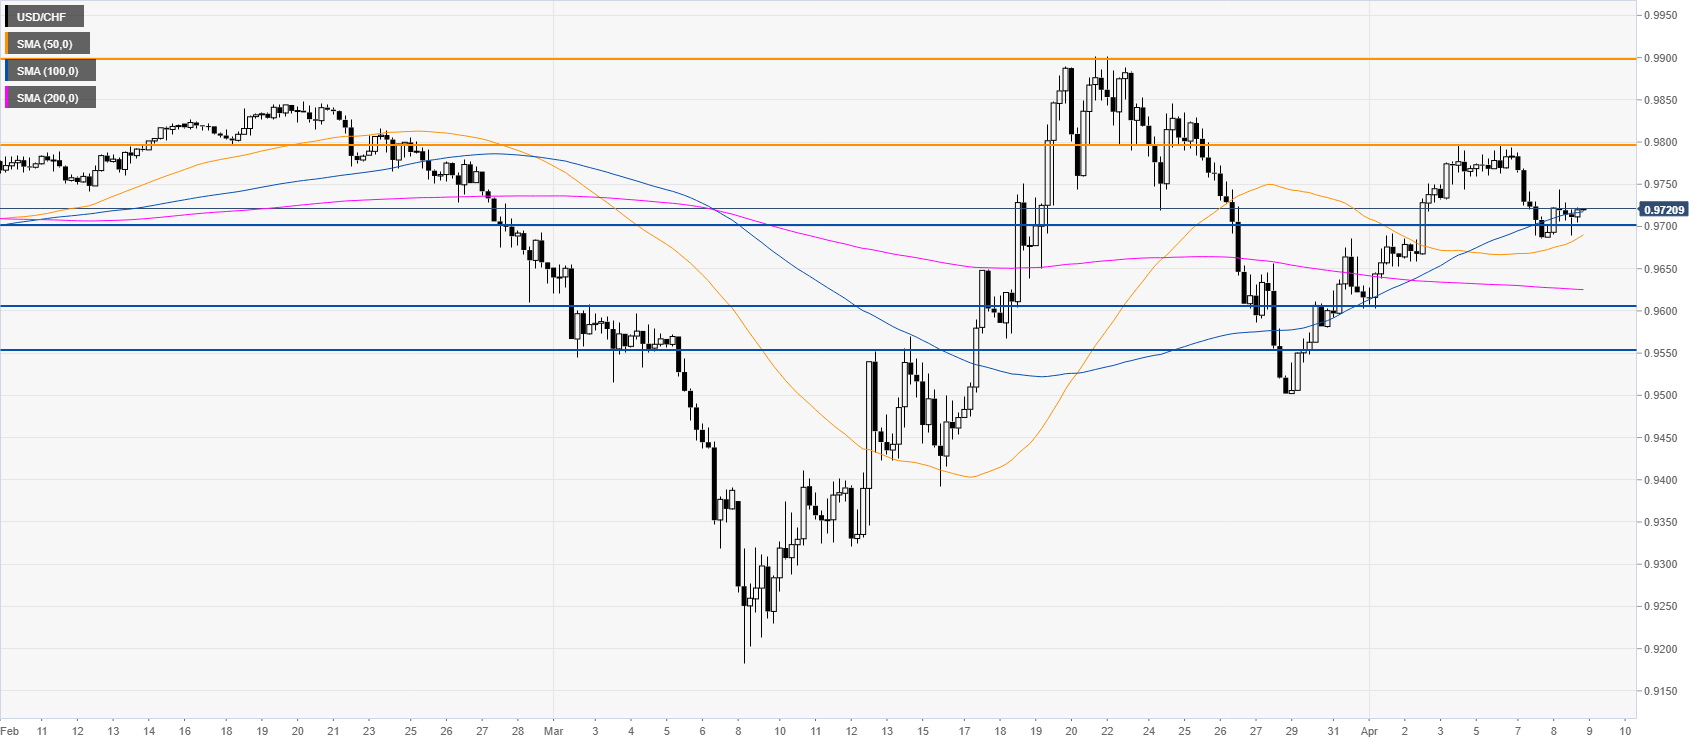
USD/CHF is trading above the 50/200 SMAs on the four-hour chart leaving the bull trend intact as bulls will be looking for a break above the 0.9800 handle en route towards the 0.9900 figure while support is expected to emerge near the 0.9700 and 0.9600 levels on the way down. 
 

Additional key levels

USD/CHF

Overview
Today last price0.972
Today Daily Change0.0026
Today Daily Change %0.27
Today daily open0.9694
 
Trends
Daily SMA200.9662
Daily SMA500.9677
Daily SMA1000.9735
Daily SMA2000.9809
 
Levels
Previous Daily High0.9793
Previous Daily Low0.9686
Previous Weekly High0.9796
Previous Weekly Low0.9502
Previous Monthly High0.9902
Previous Monthly Low0.9183
Daily Fibonacci 38.2%0.9727
Daily Fibonacci 61.8%0.9752
Daily Pivot Point S10.9655
Daily Pivot Point S20.9617
Daily Pivot Point S30.9548
Daily Pivot Point R10.9763
Daily Pivot Point R20.9832
Daily Pivot Point R30.9871

Author

Flavio Tosti

Flavio Tosti

Independent Analyst


More from Flavio Tosti

Share:

Editor's Picks

GBP/USD flirts with 1.3500 as USD finds fresh demand

GBP/USD is flatlining near the 1.3500 level in Europe on Tuesday, facing some pressure from renewed US Dollar demand as a safe-haven amid surging Oil prices and inflationary concerns. The focus now remains on the Middle East headlines, with Wednesday's US CPI data the key event risk this week.

EUR/USD stays weak near 1.1550 amid US-Iran impasse

EUR/USD struggles to gain any meaningful traction and hovers near the 1.1550 area in the European session. Traders seem hesitant to place aggressive bets and opt to wait for further developments surrounding the Middle East crisis and this week's release of the latest US inflation figures.

Gold off two-month highs, back below $4,400 amid surging Oil prices

Gold retreats from its highest level since June 5 at $4,435, touched earlier this Tuesday, and slides back below the $4,400 mark in European trading. Surging Oil prices, amid the US-Iran impasse on talks to reopen the Strait of Hormuz, rekindled inflation concerns, lending support to the US DOllar at the expense of the non-yielding bullion.

Crypto Today: Bitcoin and Ethereum consolidate, XRP dips as optimism for a US-Iran deal fades

Bitcoin (BTC) maintains a neutral outlook on Tuesday while testing support at $64,000. Investors appear to be sitting on the fence, awaiting a catalyst for a breakout above $65,000.

The inflation narrative is still way more important than the employment story
Core bonds sold off yesterday with the belly of the curve slightly underperforming in the US while European curves showed more of a bear flattening. Daily changes on the US curve varied between +4.7 bps (2-yr) and +6.4 bps (7-yr).
9-3: Is the Federal Reserve’s vote tally Warsh's new forward guidance?
The rate did not move. Neither did the statement, and that’s the more interesting fact. Set the July 29 Federal Open Market Committee (FOMC) statement beside the one issued on June 17, and the two documents are identical apart from a single verb and a paragraph at the bottom naming three dissenters.
















