|

USD/CAD Technical Analysis: The 1.3100 resistance might be a tough cookie for bulls to break above

  • USD/CAD bulls are trying hard to keep the bull trend going as they are attempting to break above the 50 and 100-day simple moving average on the daily time-frame.
  • Earlier this week, USD/CAD tried to break above 1.3100 figure. The market is now consolidating above the 1.3000 figure and the 200-period simple moving average on the 4-hour chart. However, the MACD is turning bearish and the Stochastic oscillator is sloping down but still above the 50 line, all suggesting there is still some potential remaining bullish activity which might be short-lived. Additionally, a 5-wave Elliot Wave pattern might add weight to the corrective (down) scenario. 
  • In the absence of a break above 1.3100 on a closing basis, USD/CAD might be set for sideways to down movements potentially breaking below 1.3000 figure in the coming sessions. 
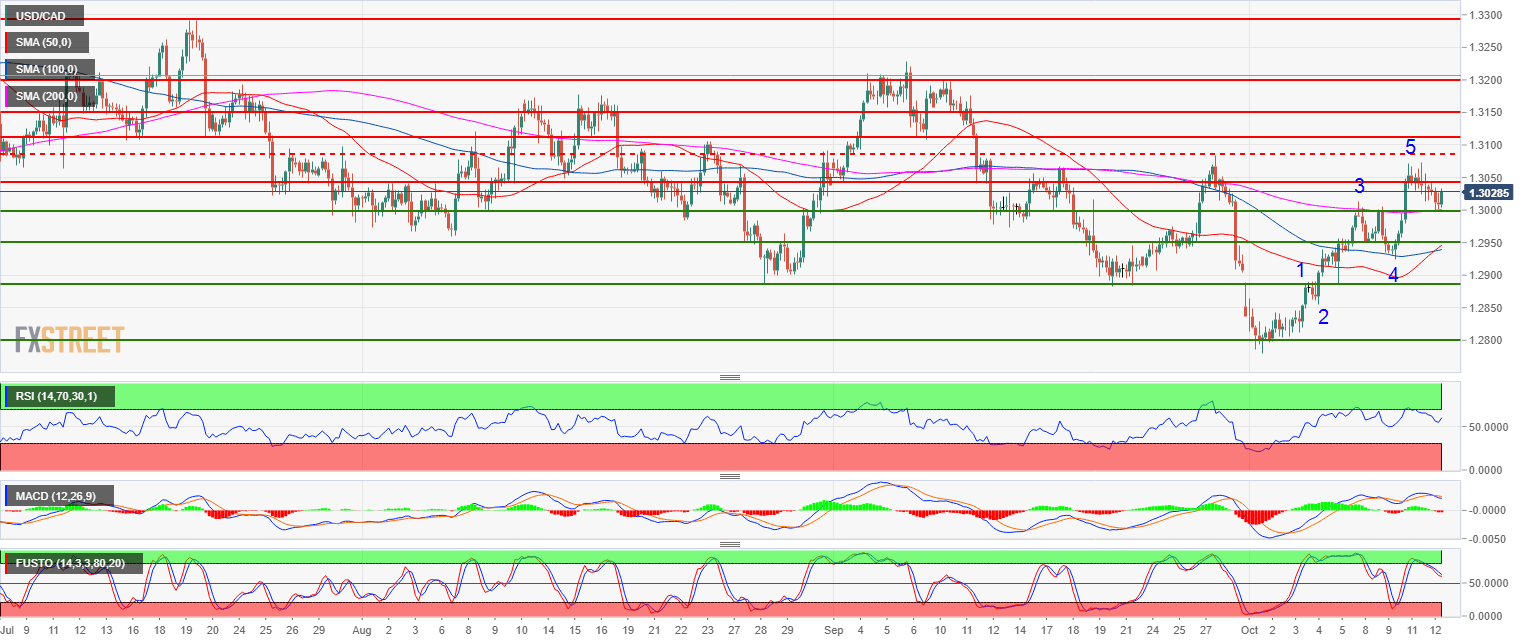
USD/CAD 4-hour chart

Spot rate:                   1.3032
Relative change:        0% 
High:                          1.3042
Low:                           1.2999

Main trend:                Bullish 


Resistance 1:            1.3048 August 14 low
Resistance 2:            1.3083 September 27 swing high
Resistance 3:            1.3108, September 7 low
Resistance 4:            1.3200 figure

Support 1:                 1.3000 figure
Support 2:                 1.2950-59 multi-month key level and August 7 low
Support 3:                 1.2882-1.2900 September 20 low and figure
Support 4:                 1.2855-65 June 6 low - 200-day SMA
Support 5:                 1.2800 figure
Support 6:                 1.2727 May 11 low

Author

Flavio Tosti

Flavio Tosti

Independent Analyst


More from Flavio Tosti
Share:

Editor's Picks

EUR/USD faces some resistance near 100-SMA on H4, around 1.1830 zone

The EUR/USD pair gains some follow-through positive traction for the second consecutive day and climbs to the 1.1830 region during the Asian session on Thursday. The US Dollar remains on the back foot amid concerns about the economic fallout from US President Donald Trump's erratic trade policies and acts as a tailwind for spot prices.

GBP/USD extends recovery to near 20-day EMA as US Dollar weakens

The Pound Sterling holds onto weekly gains around 1.3565 against the US Dollar during the Asian trading session on Thursday. The GBP/USD pair trades firmly as the US Dollar remains under pressure due to uncertainty surrounding the United States trade policy outlook.

Gold struggle with $5,200 extends ahead of more US-Iran talks

Gold is replicating the recovery moves seen in Wednesday’s Asian trading early Thursday, as buyers continue to flirt with the $5,200 level. Sustained US Dollar weakness and looming US-Iran talks aid the bright metal’s rebound.  

Stellar: Relief bounce fades as bearish undertone persists

Stellar is trading around $0.16 at the time of writing on Thursday after rebounding more than 8% in the previous day. Derivatives data paints a negative picture as XLM’s short bets hit a monthly high while Open Interest continues to decline.

Nvidia delivers another monster earnings report, and forecasts big things to come

It was another monster earnings report from Nvidia for fiscal Q4. Revenues were $68.1bn, smashing estimates of $65bn. Gross profit margin was a healthy 75%, up from 73.5% in the prior quarter, and the outlook for this quarter was monstrous.

Cosmos Hub Price Forecast: ATOM rebounds slightly, bearish outlook remains intact

Cosmos Hub (ATOM) price rebounds, trading above $2.05 at the time of writing on Wednesday, after undergoing a sharp correction since last week. Weakening on-chain and derivatives data support a bearish outlook, while technical analysis remains unfavorable.