|

USD/CAD Technical Analysis: Retreats from 200-hour SMA/ascending trend channel confluence hurdle

   •  The pair has been steadily climbing alongside a short-term ascending trend-channel formation on the 1-hourly chart since the early North-American session on Friday.

   •  The positive momentum stalled near the trend-channel resistance, also coinciding with 200-hour SMA amid a fresh wave of broad-based USD selling pressure.

   •  Considering the pair's recent decline, the ascending channel seems to constitute towards a bearish flag chart pattern formation on the mentioned chart.

   •  Moreover, technical indicators on the daily chart are still far from oversold but are yet to recover from the negative territory and add credence to the bearish outlook. 

   •  Hence, the ongoing recovery momentum might still be seen as corrective in nature and runs the risk of facing fresh supply on every attempted up-move.
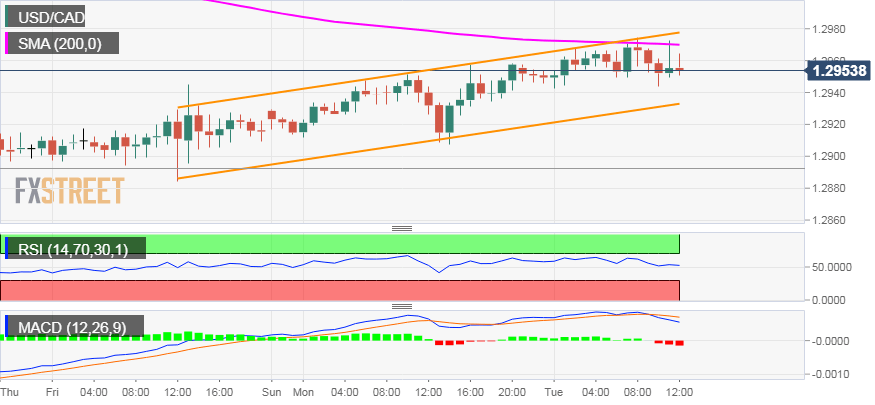
 

USD/CAD 1-hourly chart

Spot Rate: 1.2954
Daily High: 1.2973
Daily Low: 1.2945
Trend: Bullish

Resistance
R1: 1.2973 (current day swing high)
R2: 1.3000 (psychological mark)
R3: 1.3026 (R3 daily pivot-point)

Support
S1: 1.2924 (S1 daily pivot-point)
S2: 1.2900 (round figure mark)
S3: 1.2863 (200-day SMA)
 

Author

Haresh Menghani

Haresh Menghani is a detail-oriented professional with 10+ years of extensive experience in analysing the global financial markets.


More from Haresh Menghani
Share:

Editor's Picks

GBP/USD holds losses below 1.3550 after weak UK jobs data

GBP/USD holds losses below 1.3550 in European trading hours on Tuesday. The UK ILO Unemployment Rate held steady at 4.9% in the three months to June, against a forecast of 4.8%, while Employment Change arrived at 83K in the same period versus 147K previous. Weak UK labor data keep the British Pound under pressure, driving the pair lower.

EUR/USD stays below 1.1600 despite upbeat sentiment data

EUR/USD struggles to gain traction and trades below 1.1600 in the European session on Tuesday, even after the data from the Eurozone and Germany highlighted improving economic sentiment in August. The US Dollar (USD) benefits from the risk-averse market atmosphere as tensions in Middle East remain high, making it difficult for the pair to turn north.

Gold sticks to losses below $4,400 as USD recovers further from two-month low

Gold remains depressed below the $4,400 mark through the first half of the European session, snapping a two-day winning streak amid a broadly firmer US Dollar. Inflation risks stemming from higher oil prices back the case for at least one interest rate hike by the US Federal Reserve in 2026.

Pi Network holds steady amid app studio costs surge to push user adoption

Pi Network extends a consolidation range capped below $0.0900 holding above the $0.0839 support level. PI token remains under pressure as the Core Team pushes for real user adoption by raising costs for AI-powered app creation, effective from August 24. Leverage-linked risk exposure eases as Open Interest declines despite an increase in social interest.

Fiscal concerns and doubts on Fed independence send US yields to long-term highs

US Treasury yields keep rising across the curve this week, with the yield for the 30-year Treasury bond reaching its highest level since 2007, during the global financial crisis, at 5.33% so far on Monday. A mix of concerns about the ballooning US fiscal deficit and growing doubts about the Federal Reserve’s Independence are increasing pressure on US Government Bonds.

Why is Crude Oil priced for a reopening the ships haven't made?
Fourteen vessels crossed the Strait of Hormuz on Tuesday. Before the war, the count ran near 120 a day. In the sessions since the waterway was publicly declared open, Brent has drifted back to $87 and West Texas Intermediate (WTI) to $81, both a little lower again on Wednesday, with daily momentum on each unwound from the top of its range in late July to the low twenties now.














