|

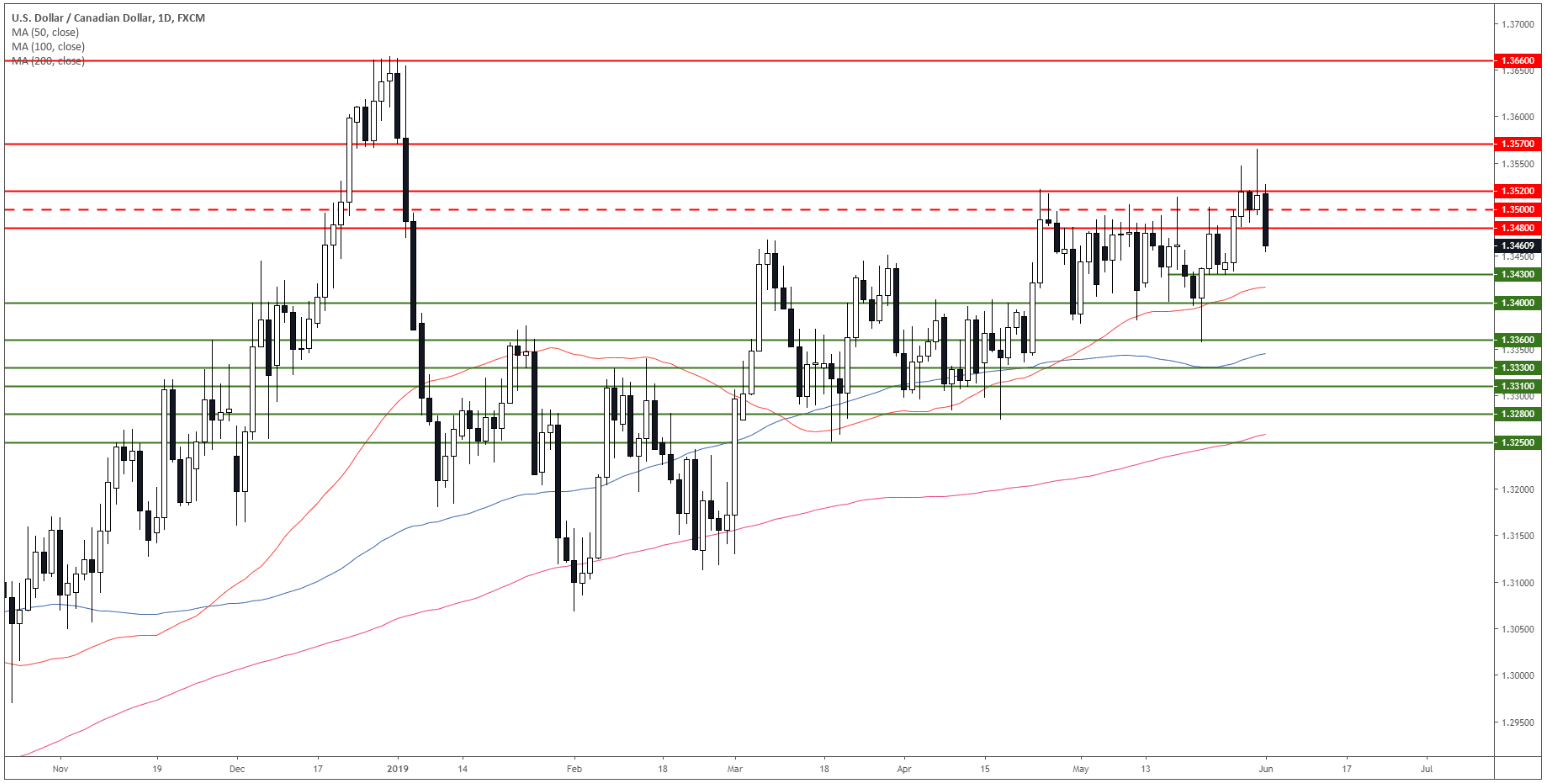
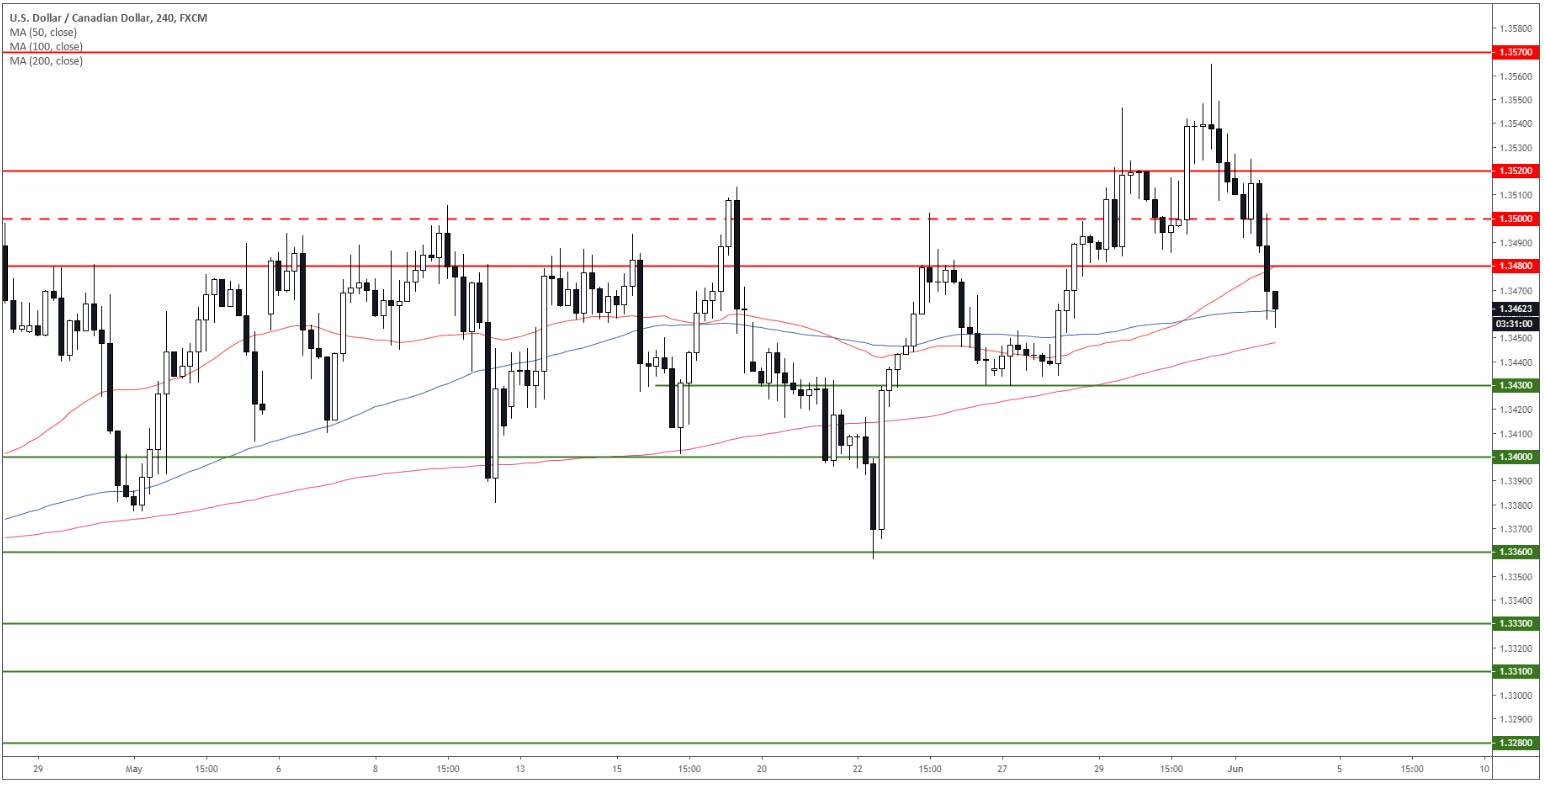
USD/CAD technical analysis: On the way down towards 1.3400

  • Both USD weakness and the consolidation on oil prices are helping USD/CAD to depreciate.
  • The next main pit-stop to the downside is seen at 1.3400.

USD/CAD daily chart

The market is trading in a bull trend above its main simple moving averages (SMAs).

USD/CAD 4-hour chart


USD/CAD is weakening as bears are trying to push the market towards 1.3430 and 1.3400 figure. Resistances are seen at 1.3480, 1.3500/20 and 1.3570. 


Additional key levels

USD/CAD

Overview
Today last price1.3464
Today Daily Change-0.0053
Today Daily Change %-0.39
Today daily open1.3517
 
Trends
Daily SMA201.3462
Daily SMA501.3417
Daily SMA1001.3344
Daily SMA2001.3266
Levels
Previous Daily High1.3566
Previous Daily Low1.3492
Previous Weekly High1.3566
Previous Weekly Low1.3429
Previous Monthly High1.3566
Previous Monthly Low1.3357
Daily Fibonacci 38.2%1.3538
Daily Fibonacci 61.8%1.352
Daily Pivot Point S11.3484
Daily Pivot Point S21.3452
Daily Pivot Point S31.3411
Daily Pivot Point R11.3557
Daily Pivot Point R21.3598
Daily Pivot Point R31.363

Author

Flavio Tosti

Flavio Tosti

Independent Analyst


More from Flavio Tosti
Share:

Editor's Picks

EUR/USD holds lower ground near 1.1850 ahead of EU/ US data

EUR/USD remains in the negative territory for the fourth successive session, trading around 1.1850 in European trading on Friday. A broadly cautious market environment paired with modest US Dollar demand undermines the pair ahead of the Eurozone GDP second estimate and the critical US CPI data. 

GBP/USD keeps losses around 1.3600, awaits US CPI for fresh impetus

GBP/USD holds moderate losses at around 1.3600 in the European session on Friday, though it lacks bearish conviction. The US Dollar remains supported amid softer risk tone and ahead of the US consumer inflation figures due later in the NA session on Friday. 

Gold trims intraday gains to $5,000 as US inflation data loom

Gold retreats from the vicinity of the $5,000 psychological mark, though sticks to its modest intraday gains heading into the European session. Traders now look forward to the release of the US consumer inflation figures for more cues about the Fed policy path. The outlook will play a key role in influencing the near-term US Dollar price dynamics and provide some meaningful impetus to the non-yielding bullion.

Solana: Mixed market sentiment caps recovery

Solana is trading at $79 as of Friday, following a correction of over 9% so far this week. On-chain and derivatives data indicates mixed sentiment among traders, further limiting the chances of a price recovery.

A tale of two labour markets: Headline strength masks underlying weakness

Undoubtedly, yesterday’s delayed US January jobs report delivered a strong headline – one that surpassed most estimates. However, optimism quickly faded amid sobering benchmark revisions.

Solana Price Forecast: Mixed market sentiment caps recovery

Solana (SOL) is trading at $79 as of Friday, following a correction of over 9% so far this week. On-chain and derivatives data indicates mixed sentiment among traders, further limiting the chances of a price recovery.