USD/CAD technical analysis: Multiple upside barriers to question latest pullback
- Support turned resistances limit immediate advances.
- RSI lacks momentum near the oversold region.

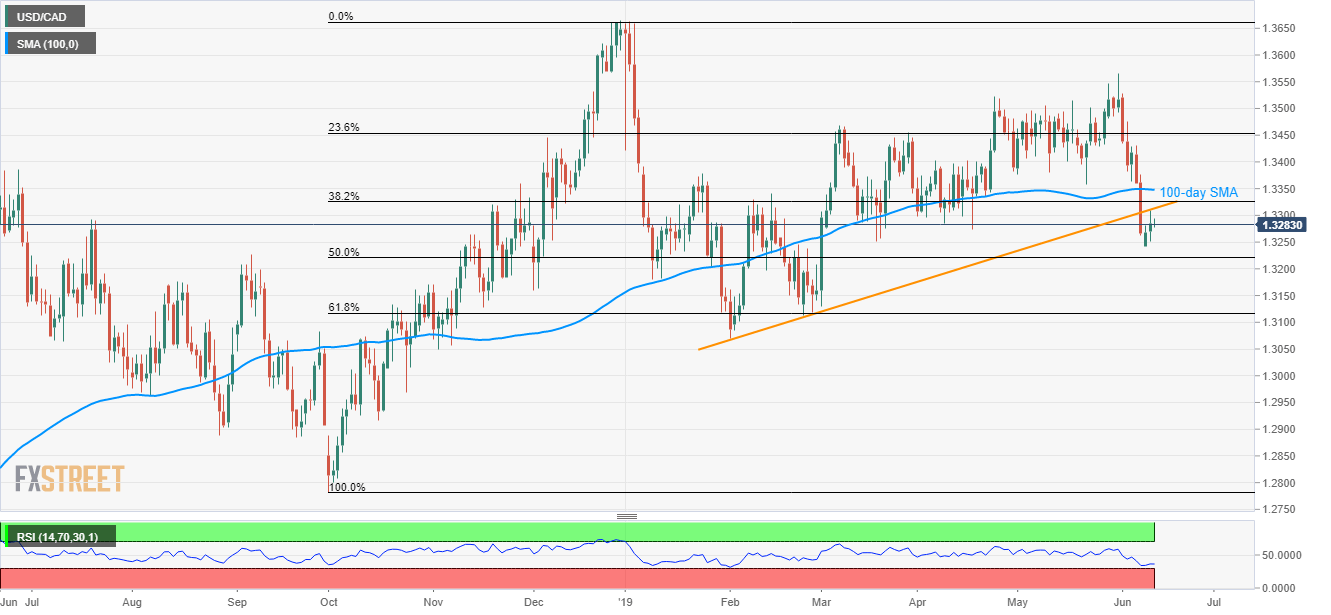
In spite of its U-turn from 1.3242, the USD/CAD pair has multiple upside barriers to cross in order to justify its latest strength as it takes the round near 1.3280 during early Wednesday.
Out of them, an 18-week long ascending trend-line (previous support now resistance) becomes the closes limit at 1.3315, a break of which may escalate the recovery towards 1.3325 figure comprising 38.2% Fibonacci retracement of its October 2018 to January 2019 upside ahead of questioning the 100-day simple moving average (SMA) level of 1.3348.
Given the price rally above 1.3350, 1.3380 and 1.3400 might flash on the bulls’ radar.
Meanwhile, 1.3242 can be considered as nearby support ahead of highlighting 50% Fibonacci retracement near 1.3220 and 1.3165 rest-point.
In a case where the quote slips under 1.3165, sellers get a license to target 61.8% Fibonacci retracement at 1.3120 and February month low near 1.3070.
It should also be noted that the 14-day relative strength index (RSI) is near oversold levels but not showing much momentum off-late.
USD/CAD daily chart
Trend: Bearish
Author

Anil Panchal
FXStreet
Anil Panchal has nearly 15 years of experience in tracking financial markets. With a keen interest in macroeconomics, Anil aptly tracks global news/updates and stays well-informed about the global financial moves and their implications.


