• USD/CAD is likely to break its bearish consolidation to the downside.
  • The relentless rise in WTI prices offset the US dollar’s advance.
  • The hourly chart shows a breach of the ascending trendline support.

USD/CAD is looking to challenge the April low of 1.2265, as the risks remain to the downside amid a rally in WTI prices.

The US oil sits at two-month highs of $66.63, as the sentiment has turned bullish on expectations of a faster vaccine-driven global economic recovery, which is likely to boost the fuel demand.

Meanwhile, the relentless surge in oil prices appears to negate the effect of a broadly firmer US dollar, exerting persistent downward pressure on the spot.

Next of note for the major remains the US ADP and ISM Services PMI reports. In the meantime, the oil price dynamics will continue to play out.

USD/CAD: Technical Outlook

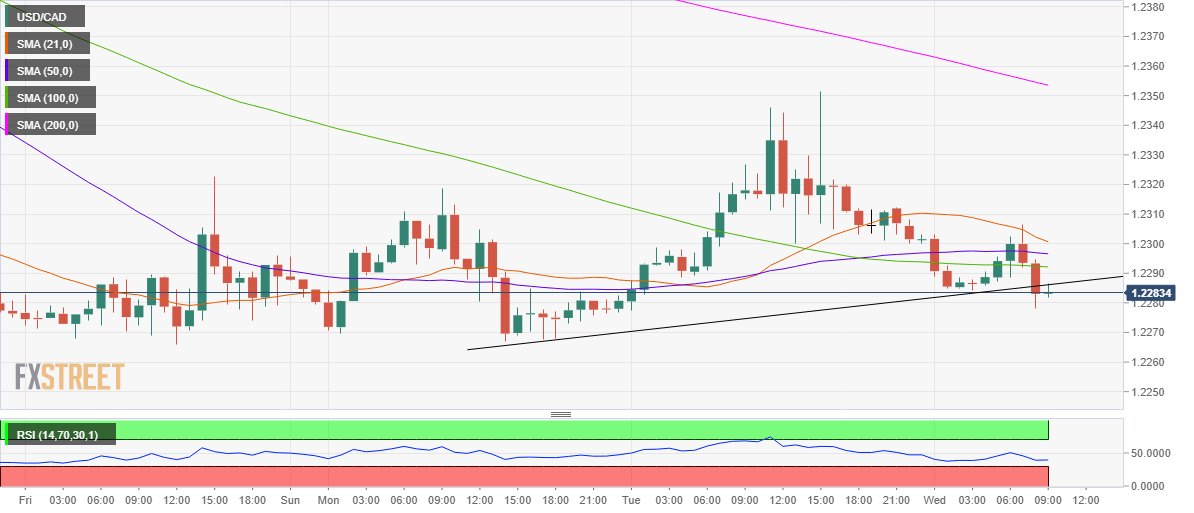
USD/CAD: Hourly chart

USD/CAD’s hourly chart shows that the price is attempting a minor bounce after having breached the two-day ascending trendline support at 1.2285.

The Relative Strength Index (RSI) has turned flat but trades at 38.58, implying that deeper losses remain on the cards.

Therefore, the April month low remains at risk, below which the psychological 1.2250 level will come into the picture.

Note that the spot is trading below all the major averages on the given time frame.            

Alternatively, buyers need to scale back above the trendline support now resistance at 1.2286 to extend the recovery momentum towards 1.2300.

USD/CAD: Additional levels

USD/CAD

Overview
Today last price 1.2285
Today Daily Change -0.0026
Today Daily Change % -0.21
Today daily open 1.2311
 
Trends
Daily SMA20 1.2463
Daily SMA50 1.253
Daily SMA100 1.2634
Daily SMA200 1.2892
 
Levels
Previous Daily High 1.2352
Previous Daily Low 1.2276
Previous Weekly High 1.2491
Previous Weekly Low 1.2266
Previous Monthly High 1.2654
Previous Monthly Low 1.2266
Daily Fibonacci 38.2% 1.2323
Daily Fibonacci 61.8% 1.2305
Daily Pivot Point S1 1.2274
Daily Pivot Point S2 1.2237
Daily Pivot Point S3 1.2198
Daily Pivot Point R1 1.235
Daily Pivot Point R2 1.2388
Daily Pivot Point R3 1.2425


Information on these pages contains forward-looking statements that involve risks and uncertainties. Markets and instruments profiled on this page are for informational purposes only and should not in any way come across as a recommendation to buy or sell in these assets. You should do your own thorough research before making any investment decisions. FXStreet does not in any way guarantee that this information is free from mistakes, errors, or material misstatements. It also does not guarantee that this information is of a timely nature. Investing in Open Markets involves a great deal of risk, including the loss of all or a portion of your investment, as well as emotional distress. All risks, losses and costs associated with investing, including total loss of principal, are your responsibility. The views and opinions expressed in this article are those of the authors and do not necessarily reflect the official policy or position of FXStreet nor its advertisers. The author will not be held responsible for information that is found at the end of links posted on this page.

If not otherwise explicitly mentioned in the body of the article, at the time of writing, the author has no position in any stock mentioned in this article and no business relationship with any company mentioned. The author has not received compensation for writing this article, other than from FXStreet.

FXStreet and the author do not provide personalized recommendations. The author makes no representations as to the accuracy, completeness, or suitability of this information. FXStreet and the author will not be liable for any errors, omissions or any losses, injuries or damages arising from this information and its display or use. Errors and omissions excepted.

The author and FXStreet are not registered investment advisors and nothing in this article is intended to be investment advice.

Feed news Join Telegram

Recommended content


Recommended content

Editors’ Picks

EUR/USD retreats toward 1.0550 as dollar rebounds

EUR/USD retreats toward 1.0550 as dollar rebounds

EUR/USD has lost its traction in the American session and retreated to the 1.0550 area. In the absence of high-tier macroeconomic data releases, the dollar is staging a rebound with the US Dollar Index rising above 103.00 and forcing the pair to edge lower.

EUR/USD News

GBP/USD consolidates its weekly gains below 1.2500

GBP/USD consolidates its weekly gains below 1.2500

GBP/USD has extended its sideways grind below 1.2500 into the second half of the day on Friday with the dollar staying resilient against its rivals. Nevertheless, the pair remains on track to snap a four-week losing streak.

GBP/USD News

Gold loses traction, drops below $1,840

Gold loses traction, drops below $1,840

Gold came under modest bearish pressure in the American session on Friday and dropped below $1,840. The benchmark 10-year US Treasury bond yield stays quiet above 2.8%, helping XAU/USD limit its losses ahead of the weekend.

Gold News

Bitcoin price will bounce to $36,000, but what happens next will leave you shocked

Bitcoin price will bounce to $36,000, but what happens next will leave you shocked

A brief technical and on-chain analysis on Bitcoin price. Here, analysts evaluate where BTC could be heading next. Does the possibility for a cat bounce make sense?

Read more

PANW shows bullish reversal chart pattern after earnings beat

PANW shows bullish reversal chart pattern after earnings beat

PANW stock benefits from continued strong revenue growth. Palo Alto Networks now nearly services half of the Global 2000. PANW stock is showing a bullish reversal pattern on its daily chart.

Read more

Forex MAJORS

Cryptocurrencies

Signatures