USD/CAD recaptures 200-DMA amid falling WTI prices, risk-aversion


  • USD/CAD hits fresh three-month highs near 1.2650.
  • Risk-off mood amid covid woes boosts DXY, OPEC+ deal knocks off WTI.
  • The loonie recaptures 200-DMA, further upside remains in the offing.

USD/CAD is flirting with three-month highs near the midpoint of the 1.2600 level, as the bulls remain unstoppable amid three consecutive days of gains this Monday.

The currency pair receives support from two fronts, the first with the US dollar rising higher on the risk-aversion wave, thanks to the rising Delta covid variant cases worldwide.

On the other side, WTI prices tumble over 1% to breach $71 after OPEC and its allies (OPEC+) struck a deal over the weekend to boost oil supplies, in order to stem the price surge. The fall in oil prices dent the sentiment around the resource-linked WTI.  

Looking forward, the broader market sentiment will remain the main market motor amid a lack of relevant economic news while covid and inflation fears continue to loom.

USD/CAD technical outlook

USD/CAD’s daily chart shows that the recent uptrend has prompted the rates to recapture the slightly bearish 200-Daily Moving Average (DMA) at 1.2625.

The 14-day Relative Strength Index (RSI) is holding firmer, currently probing the overbought region, suggesting that there is more room for the upside.

If the bulls manage to hold ground at higher levels, a fresh advance towards the horizontal (orange) trendline resistance at 1.2705 cannot be ruled.

Ahead of that, the pair need a firm break above the 1.2657, April highs.

USD/CAD daily chart

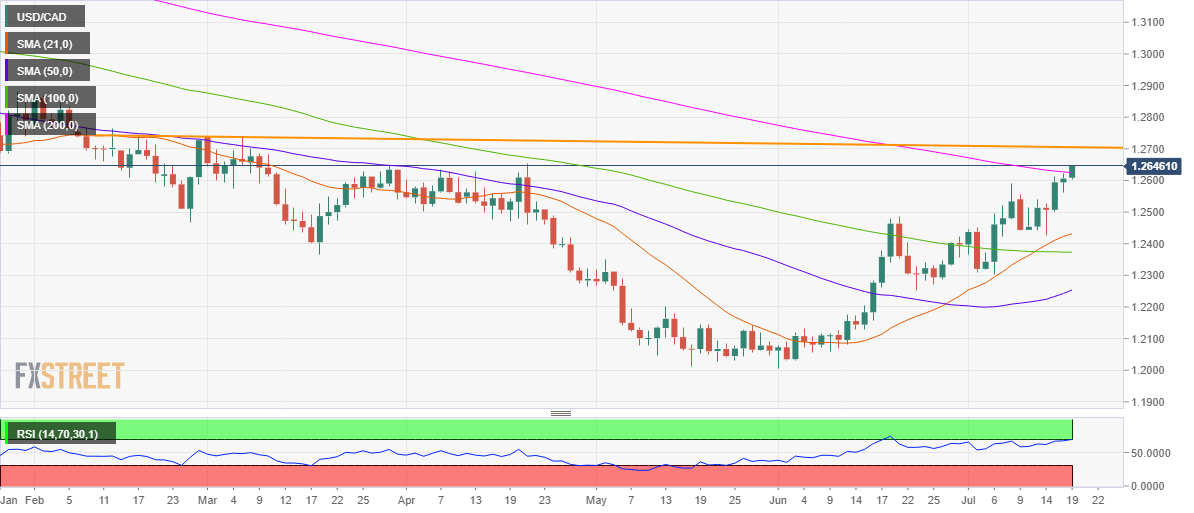
On the flip side, the 200-DMA – earlier resistance now support could limit the pullback, below which the 1.2600 round number could guard the downside.

The next significant support awaits at Friday’s low of 1.2561.

USD/CAD additional levels to watch

USD/CAD

Overview
Today last price 1.2645
Today Daily Change 0.0041
Today Daily Change % 0.33
Today daily open 1.2606
 
Trends
Daily SMA20 1.2421
Daily SMA50 1.2243
Daily SMA100 1.2373
Daily SMA200 1.2627
 
Levels
Previous Daily High 1.2621
Previous Daily Low 1.2561
Previous Weekly High 1.2621
Previous Weekly Low 1.2427
Previous Monthly High 1.2487
Previous Monthly Low 1.2007
Daily Fibonacci 38.2% 1.2598
Daily Fibonacci 61.8% 1.2584
Daily Pivot Point S1 1.2571
Daily Pivot Point S2 1.2536
Daily Pivot Point S3 1.2512
Daily Pivot Point R1 1.263
Daily Pivot Point R2 1.2655
Daily Pivot Point R3 1.269


Share: Feed news

Information on these pages contains forward-looking statements that involve risks and uncertainties. Markets and instruments profiled on this page are for informational purposes only and should not in any way come across as a recommendation to buy or sell in these assets. You should do your own thorough research before making any investment decisions. FXStreet does not in any way guarantee that this information is free from mistakes, errors, or material misstatements. It also does not guarantee that this information is of a timely nature. Investing in Open Markets involves a great deal of risk, including the loss of all or a portion of your investment, as well as emotional distress. All risks, losses and costs associated with investing, including total loss of principal, are your responsibility. The views and opinions expressed in this article are those of the authors and do not necessarily reflect the official policy or position of FXStreet nor its advertisers. The author will not be held responsible for information that is found at the end of links posted on this page.

If not otherwise explicitly mentioned in the body of the article, at the time of writing, the author has no position in any stock mentioned in this article and no business relationship with any company mentioned. The author has not received compensation for writing this article, other than from FXStreet.

FXStreet and the author do not provide personalized recommendations. The author makes no representations as to the accuracy, completeness, or suitability of this information. FXStreet and the author will not be liable for any errors, omissions or any losses, injuries or damages arising from this information and its display or use. Errors and omissions excepted.

The author and FXStreet are not registered investment advisors and nothing in this article is intended to be investment advice.

Recommended content


Recommended content

Editors’ Picks

AUD/USD jumps above 0.6500 after hot Australian CPI data

AUD/USD jumps above 0.6500 after hot Australian CPI data

AUD/USD extended gains and recaptured 0.6500 in Asian trading, following the release of hotter-than-expected Australian inflation data. The Australian CPI rose 1% in QoQ in Q1 against 0.8% forecast, providing extra legs to the Australian Dollar upside. 

AUD/USD News

USD/JPY hangs near 34-year high at 154.88 as intervention risks loom

USD/JPY hangs near 34-year high at 154.88 as intervention risks loom

USD/JPY is sitting at a multi-decade high of 154.88 reached on Tuesday. Traders refrain from placing fresh bets on the pair as Japan's FX intervention risks loom. Broad US Dollar weakness also caps the upside in the major. US Durable Goods data are next on tap. 

USD/JPY News

Gold price cautious despite weaker US Dollar and falling US yields

Gold price cautious despite weaker US Dollar and falling US yields

Gold retreats modestly after failing to sustain gains despite fall in US Treasury yields, weaker US Dollar. XAU/USD struggles to capitalize following release of weaker-than-expected S&P Global PMIs, fueling speculation about potential Fed rate cuts.

Gold News

Crypto community reacts as BRICS considers launching stablecoin for international trade settlement

Crypto community reacts as BRICS considers launching stablecoin for international trade settlement

BRICS is intensifying efforts to reduce its reliance on the US dollar after plans for its stablecoin effort surfaced online on Tuesday. Most people expect the stablecoin to be backed by gold, considering BRICS nations have been accumulating large holdings of the commodity.

Read more

US versus the Eurozone: Inflation divergence causes monetary desynchronization

US versus the Eurozone: Inflation divergence causes monetary desynchronization

Historically there is a very close correlation between changes in US Treasury yields and German Bund yields. This is relevant at the current juncture, considering that the recent hawkish twist in the tone of the Fed might continue to push US long-term interest rates higher and put upward pressure on bond yields in the Eurozone.

Read more

Forex MAJORS

Cryptocurrencies

Signatures