USD/CAD Price Forecast: Trades indecisively around 1.4300 ahead of US/Canada Employment data
- USD/CAD wobbles around 1.4300 ahead of the US/Canada labor market data for February.
- US President Trump has announced tariff relaxation on a number of imports from Canada and Mexico.
- The US Dollar Index posts a fresh four-month low near 103.60.

The USD/CAD pair trades in a tight range around 1.4300 in European trading hours on Friday. The Loonie pair struggles for direction as investors await the employment data for February from both the United States (US) and Canada.
The US NFP report is expected to show that the economy added 160K fresh workers, higher than 143K recorded in January. The Unemployment Rate is seen steady at 4%.
In the Canadian region, economists see a fresh addition of 20K workers, fewer than 76K in January. The jobless rate is expected to have accelerated to 6.7% from 6.6% in January.
Meanwhile, the Canadian Dollar (CAD) failed to discover an interim relief despite US President Donald Trump's confirmed tariff exemption on a significant number of products compliant with the United States-Mexico-Canada agreement (USMCA). The CAD is almost sideways against the US Dollar (USD) despite the latter has extended its downside. The US Dollar Index (DXY), which tracks the Greenback’s value against six major currencies, tumbles to near 103.60, the lowest level seen in four months.
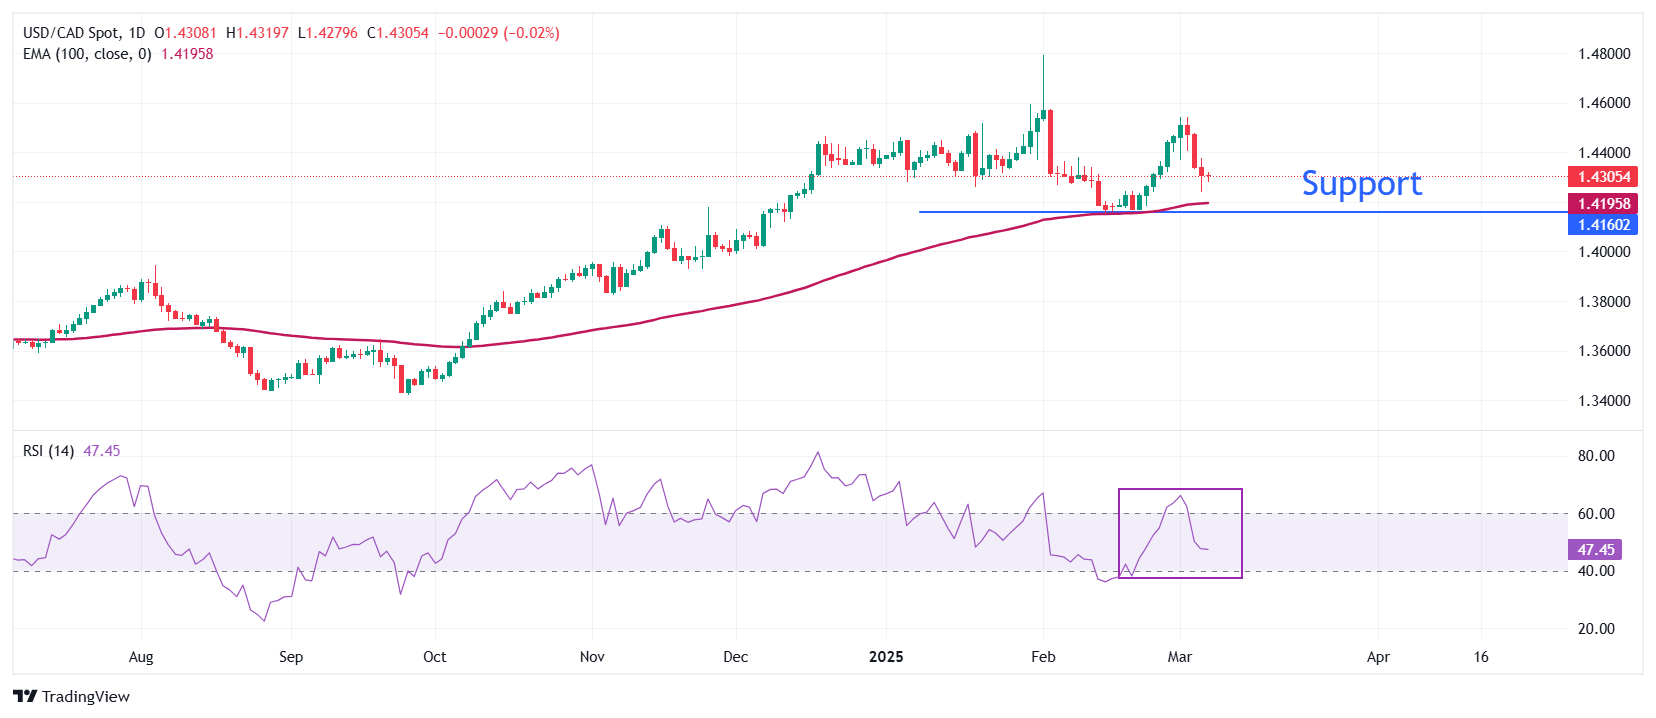
USD/CAD trades inside Thursday’s trading range around 1.4300 on Friday. The Loonie pair holds above the 100-period Exponential Moving Average (EMA), which is around 1.4200, suggesting that the overall trend is bullish.
The 14-period Relative Strength Index (RSI) oscillates in the 40.00-60.00 range, suggesting a sideways trend.
Going forward, an upside move above the February 9 high of 1.4380 will open the door toward the round-level hurdle of 1.4400 and the psychological resistance of 1.4500.
On the contrary, a breakdown below the February 14 low of 1.4151 by the pair would expose it to the December 9 low of 1.4094, followed by the December 6 low of 1.4020.
USD/CAD daily chart
US Dollar FAQs
The US Dollar (USD) is the official currency of the United States of America, and the ‘de facto’ currency of a significant number of other countries where it is found in circulation alongside local notes. It is the most heavily traded currency in the world, accounting for over 88% of all global foreign exchange turnover, or an average of $6.6 trillion in transactions per day, according to data from 2022. Following the second world war, the USD took over from the British Pound as the world’s reserve currency. For most of its history, the US Dollar was backed by Gold, until the Bretton Woods Agreement in 1971 when the Gold Standard went away.
The most important single factor impacting on the value of the US Dollar is monetary policy, which is shaped by the Federal Reserve (Fed). The Fed has two mandates: to achieve price stability (control inflation) and foster full employment. Its primary tool to achieve these two goals is by adjusting interest rates. When prices are rising too quickly and inflation is above the Fed’s 2% target, the Fed will raise rates, which helps the USD value. When inflation falls below 2% or the Unemployment Rate is too high, the Fed may lower interest rates, which weighs on the Greenback.
In extreme situations, the Federal Reserve can also print more Dollars and enact quantitative easing (QE). QE is the process by which the Fed substantially increases the flow of credit in a stuck financial system. It is a non-standard policy measure used when credit has dried up because banks will not lend to each other (out of the fear of counterparty default). It is a last resort when simply lowering interest rates is unlikely to achieve the necessary result. It was the Fed’s weapon of choice to combat the credit crunch that occurred during the Great Financial Crisis in 2008. It involves the Fed printing more Dollars and using them to buy US government bonds predominantly from financial institutions. QE usually leads to a weaker US Dollar.
Quantitative tightening (QT) is the reverse process whereby the Federal Reserve stops buying bonds from financial institutions and does not reinvest the principal from the bonds it holds maturing in new purchases. It is usually positive for the US Dollar.
Author

Sagar Dua
FXStreet
Sagar Dua is associated with the financial markets from his college days. Along with pursuing post-graduation in Commerce in 2014, he started his markets training with chart analysis.


