USD/CAD Price Forecast: Trades firmly near 1.3800 ahead of US Retail Sales data
- USD/CAD clings to gains around 1.3800 as hot US PPI strengthens the US Dollar.
- US Retail Sales are seen higher at 0.5% in July.
- BoC officials see room for further interest rate cuts.

The USD/CAD pair holds onto Thursday’s gains around 1.3800 during the Asian trading session on Friday. The Loonie pair trades firmly as the US Dollar (USD) has strengthened, following the release of the hotter-than-projected United States (US) Producer Price Index (PPI) data for July.
At the time of writing, the US Dollar Index (DXY), which tracks the Greenback’s value against six major currencies, clings to Thursday’s gains around 98.00.
The PPI report showed that both headline and core producer inflation rose by 0.9% on month, faster than expectations of 0.2%. Market experts believe that business owners are also passing on the impact of tariffs to consumers rather than absorbing into profits. However, traders are still confident that the Federal Reserve (Fed) will reduce interest rates in the September meeting due to cooling labor market conditions.
In Friday’s session, investors will focus on the US Retail Sales data for July, which will be published at 12:30 GMT. Economists expect Retail Sales to have grown by 0.5% on month, slower than the prior reading of 0.6%.
Meanwhile, the Canadian Dollar (CAD) trades cautiously as Bank of Canada (BoC) members discussed, in the July policy meeting, whether interest rates are low enough to weather the impact of tariffs imposed by the US, BoC Summary of Deliberations showed on Wednesday. In the meeting, the BoC held interest rates steady at 2.75%.
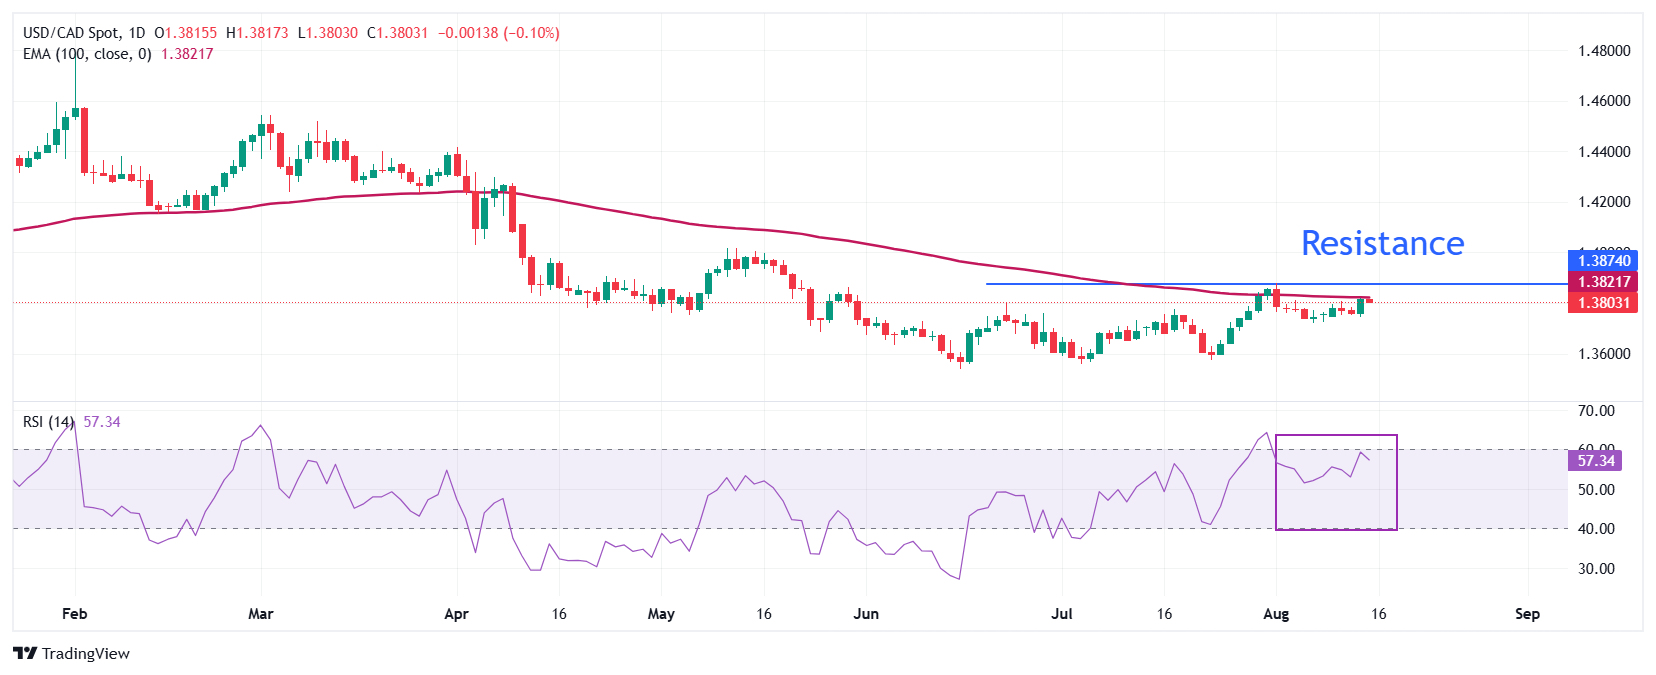
USD/CAD strives to extend its upside move above the 100-day Moving Average (MA), which trades around 1.3822. The 14-day Relative Strength Index (RSI) rises to near 60.00. A fresh bullish momentum would emerge if the RSI breaks above that level.
Going forward, an upside move by the pair above the August 1 high of 1.3880 would open the door towards the May 15 high of 1.4000, followed by the April 9 low of 1.4075.
On the contrary, the asset could slide towards the psychological level of 1.3500 and the September 25 low of 1.3420 if it breaks below the June 16 low of 1.3540.
USD/CAD daily chart
US Dollar FAQs
The US Dollar (USD) is the official currency of the United States of America, and the ‘de facto’ currency of a significant number of other countries where it is found in circulation alongside local notes. It is the most heavily traded currency in the world, accounting for over 88% of all global foreign exchange turnover, or an average of $6.6 trillion in transactions per day, according to data from 2022. Following the second world war, the USD took over from the British Pound as the world’s reserve currency. For most of its history, the US Dollar was backed by Gold, until the Bretton Woods Agreement in 1971 when the Gold Standard went away.
The most important single factor impacting on the value of the US Dollar is monetary policy, which is shaped by the Federal Reserve (Fed). The Fed has two mandates: to achieve price stability (control inflation) and foster full employment. Its primary tool to achieve these two goals is by adjusting interest rates. When prices are rising too quickly and inflation is above the Fed’s 2% target, the Fed will raise rates, which helps the USD value. When inflation falls below 2% or the Unemployment Rate is too high, the Fed may lower interest rates, which weighs on the Greenback.
In extreme situations, the Federal Reserve can also print more Dollars and enact quantitative easing (QE). QE is the process by which the Fed substantially increases the flow of credit in a stuck financial system. It is a non-standard policy measure used when credit has dried up because banks will not lend to each other (out of the fear of counterparty default). It is a last resort when simply lowering interest rates is unlikely to achieve the necessary result. It was the Fed’s weapon of choice to combat the credit crunch that occurred during the Great Financial Crisis in 2008. It involves the Fed printing more Dollars and using them to buy US government bonds predominantly from financial institutions. QE usually leads to a weaker US Dollar.
Quantitative tightening (QT) is the reverse process whereby the Federal Reserve stops buying bonds from financial institutions and does not reinvest the principal from the bonds it holds maturing in new purchases. It is usually positive for the US Dollar.
Author

Sagar Dua
FXStreet
Sagar Dua is associated with the financial markets from his college days. Along with pursuing post-graduation in Commerce in 2014, he started his markets training with chart analysis.


