USD/CAD Price Forecast: Tests nine-day EMA close to 1.3900 within an ascending channel
- The USD/CAD pair finds immediate resistance at the nine-day EMA at the 1.3885 level.
- The bullish bias prevails as the 14-day RSI is positioned above 50 level.
- The immediate support appears around the 14-day EMA at the 1.3868 level.

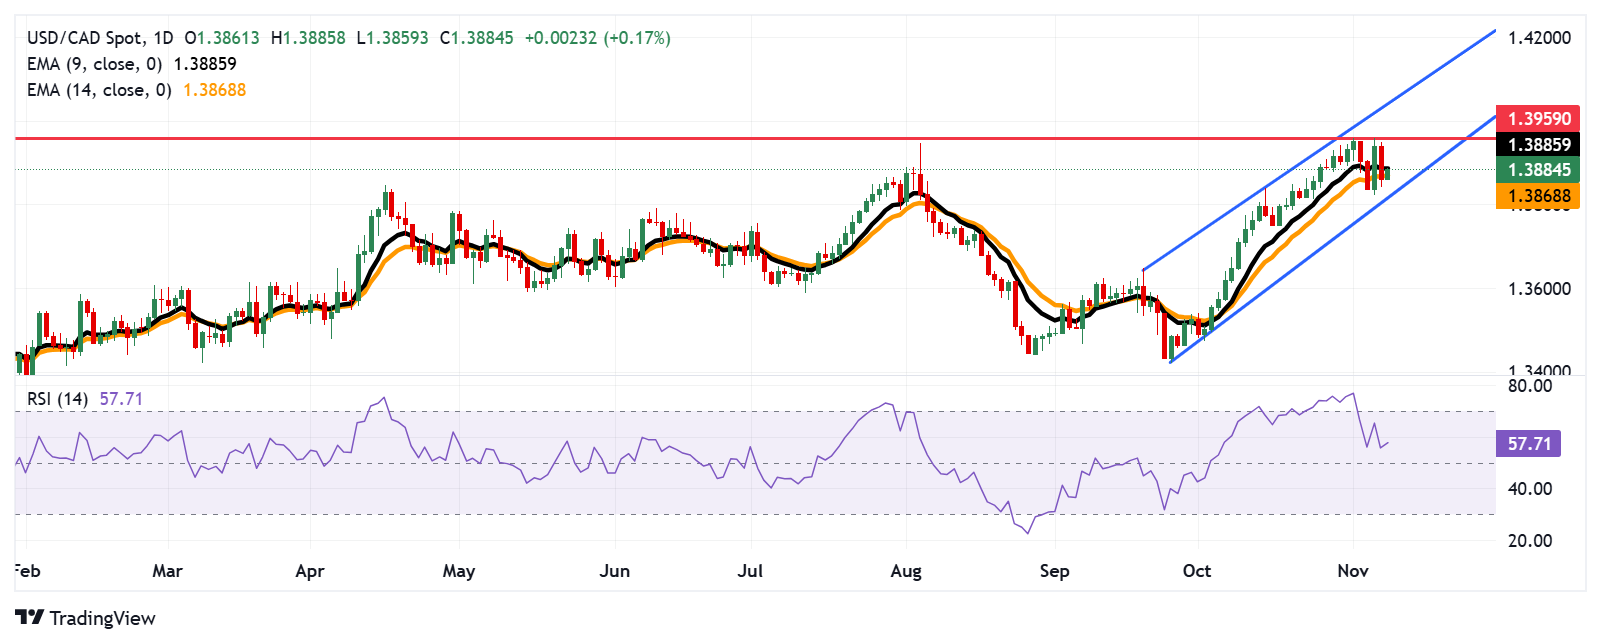
The USD/CAD pair gains ground to near 1.3880 during the Asian trading session on Friday. On the daily chart, the analysis shows that the pair is consolidating within an ascending channel, suggesting an ongoing bullish bias.
The 14-day Relative Strength Index (RSI) is positioned above the 50 level, reinforcing the prevailing bullish sentiment. Additionally, the nine-day Exponential Moving Average (EMA) is positioned above the 14-day EMA, indicating short-term price movement upwards.
On the upside, the USD/CAD pair tests the immediate barrier at the nine-day EMA at 1.3885, followed by 1.3959, the highest level since October 2022, which was reached on November 1. A break above the latter could improve the market sentiment and support the pair to approach the upper boundary of the ascending channel at the 1.4040 level.
In terms of support, the USD/CAD pair could test immediate support around the 14-day EMA at the 1.3868 level. A break below this level could cause the weakening of the bullish bias and put downward pressure on the pair to test the lower boundary of the ascending channel at the 1.3820 level.
USD/CAD: Daily Chart
Canadian Dollar PRICE Today
The table below shows the percentage change of Canadian Dollar (CAD) against listed major currencies today. Canadian Dollar was the weakest against the US Dollar.
| USD | EUR | GBP | JPY | CAD | AUD | NZD | CHF | |
|---|---|---|---|---|---|---|---|---|
| USD | 0.24% | 0.12% | 0.00% | 0.19% | 0.42% | 0.33% | 0.17% | |
| EUR | -0.24% | -0.11% | -0.20% | -0.06% | 0.20% | 0.10% | -0.07% | |
| GBP | -0.12% | 0.11% | -0.08% | 0.05% | 0.28% | 0.20% | 0.04% | |
| JPY | 0.00% | 0.20% | 0.08% | 0.17% | 0.40% | 0.31% | 0.15% | |
| CAD | -0.19% | 0.06% | -0.05% | -0.17% | 0.23% | 0.15% | -0.01% | |
| AUD | -0.42% | -0.20% | -0.28% | -0.40% | -0.23% | -0.09% | -0.25% | |
| NZD | -0.33% | -0.10% | -0.20% | -0.31% | -0.15% | 0.09% | -0.16% | |
| CHF | -0.17% | 0.07% | -0.04% | -0.15% | 0.00% | 0.25% | 0.16% |
The heat map shows percentage changes of major currencies against each other. The base currency is picked from the left column, while the quote currency is picked from the top row. For example, if you pick the Canadian Dollar from the left column and move along the horizontal line to the US Dollar, the percentage change displayed in the box will represent CAD (base)/USD (quote).
Author

Akhtar Faruqui
FXStreet
Akhtar Faruqui is a Forex Analyst based in New Delhi, India. With a keen eye for market trends and a passion for dissecting complex financial dynamics, he is dedicated to delivering accurate and insightful Forex news and analysis.


