USD/CAD Price Forecast: Tests 1.4400; next barrier appears near multi-year highs
- USD/CAD could test 1.4518, the highest level since March 2020.
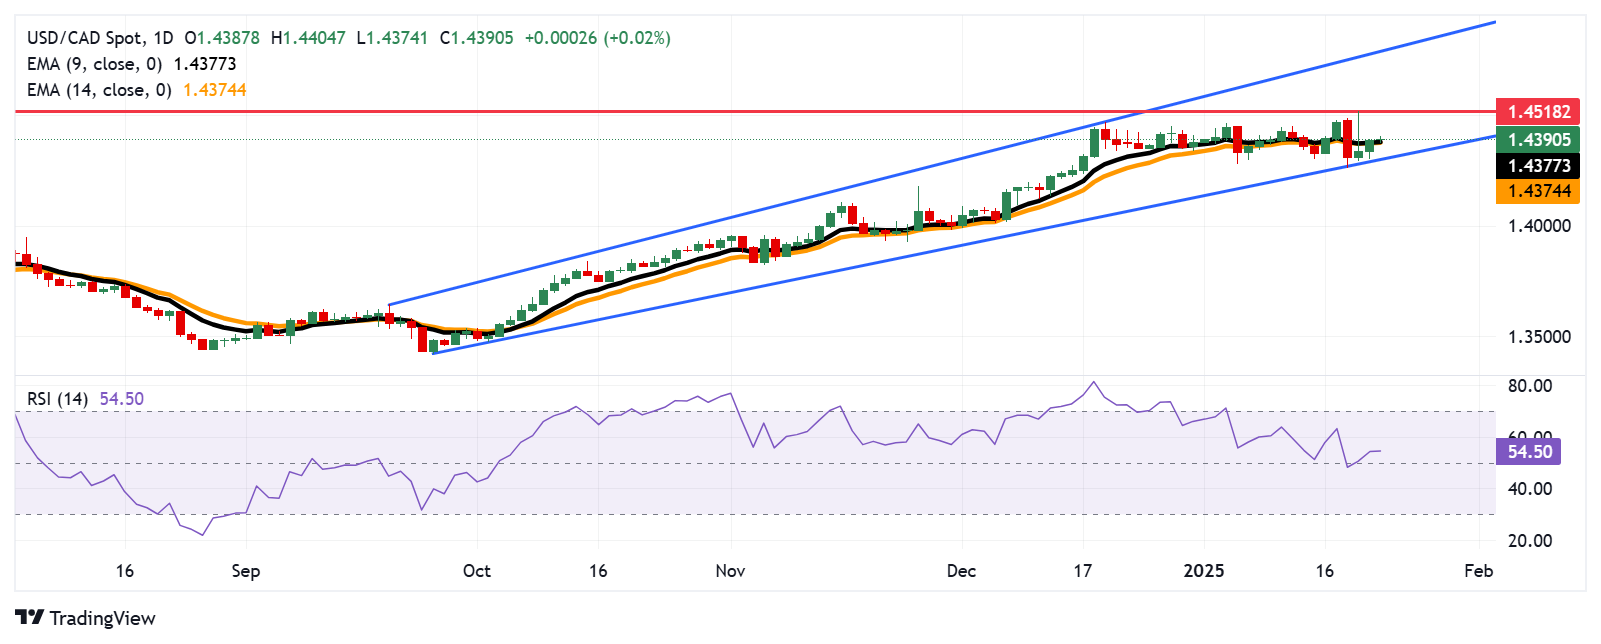
- The bullish bias persists, as the 14-day RSI stays above the 50 mark.
- Initial support for the pair is provided by the nine-day EMA at the 1.4377 level.

The USD/CAD pair continues its upward trend for the third consecutive session, hovering around 1.4390 during Thursday’s Asian trading hours. Technically, the daily chart shows the pair moving within an ascending channel, suggesting a prevailing bullish outlook.
The 14-day Relative Strength Index (RSI) remains just above the 50 mark, indicating sustained positive momentum. A sustained RSI above 50 would likely reinforce this bullish sentiment.
Additionally, the USD/CAD pair trades slightly above the nine- and 14-day Exponential Moving Averages (EMAs), further emphasizing the bullish trend and strong short-term price action. This alignment points to robust buying interest and signals the possibility of additional upward movement.
On the upside, the USD/CAD pair tests the psychological level of 1.4400, remaining poised to test 1.4518, its highest point since March 2020, reached on January 21. Further resistance is seen at the upper boundary of the ascending channel, close to the key psychological level of 1.4800.
Initial support is found around the nine-day EMA at 1.4377, followed by the 14-day EMA at 1.4374, which coincides with the lower boundary of the ascending channel.
USD/CAD: Daily Chart
(This story was corrected on January 23 at 08:00 GMT to say, in the first bullet and the fourth paragraph, that the pair could test 1.4518, the highest level since March 2020, not the 1.4485 level.)
Canadian Dollar PRICE Today
The table below shows the percentage change of Canadian Dollar (CAD) against listed major currencies today. Canadian Dollar was the weakest against the Swiss Franc.
| USD | EUR | GBP | JPY | CAD | AUD | NZD | CHF | |
|---|---|---|---|---|---|---|---|---|
| USD | 0.03% | 0.01% | -0.02% | 0.01% | -0.01% | -0.01% | -0.03% | |
| EUR | -0.03% | -0.02% | -0.08% | -0.02% | -0.05% | -0.05% | -0.07% | |
| GBP | -0.01% | 0.02% | -0.04% | 0.00% | -0.03% | -0.02% | -0.05% | |
| JPY | 0.02% | 0.08% | 0.04% | 0.04% | 0.02% | -0.03% | -0.01% | |
| CAD | -0.01% | 0.02% | -0.00% | -0.04% | -0.02% | -0.03% | -0.05% | |
| AUD | 0.01% | 0.05% | 0.03% | -0.02% | 0.02% | 0.00% | -0.02% | |
| NZD | 0.01% | 0.05% | 0.02% | 0.03% | 0.03% | -0.00% | -0.02% | |
| CHF | 0.03% | 0.07% | 0.05% | 0.01% | 0.05% | 0.02% | 0.02% |
The heat map shows percentage changes of major currencies against each other. The base currency is picked from the left column, while the quote currency is picked from the top row. For example, if you pick the Canadian Dollar from the left column and move along the horizontal line to the US Dollar, the percentage change displayed in the box will represent CAD (base)/USD (quote).
Author

Akhtar Faruqui
FXStreet
Akhtar Faruqui is a Forex Analyst based in New Delhi, India. With a keen eye for market trends and a passion for dissecting complex financial dynamics, he is dedicated to delivering accurate and insightful Forex news and analysis.


