USD/CAD Price Forecast: Tests 1.3800; grapples to remain within the ascending channel
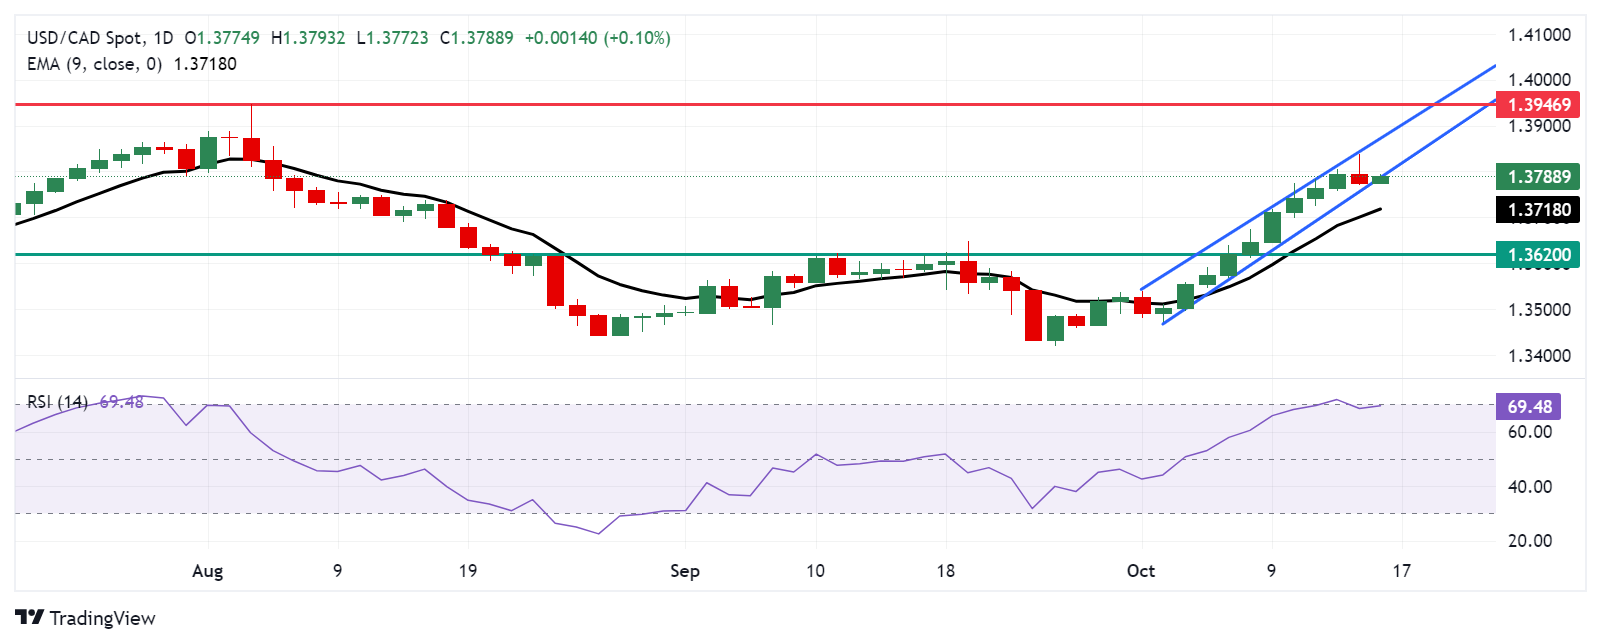
- The USD/CAD pair tests the lower boundary of the ascending channel at 1.3790 level.
- The 14-day RSI remains close to the 70 mark, indicating overbought conditions and forthcoming downward correction.
- The pair could target the upper boundary around the 1.3870 level if it remains within the ascending channel.

The USD/CAD pair recovers from recent losses and trades around 1.3790 during European hours on Wednesday. On the daily chart, the analysis shows that the pair is testing the lower boundary of an ascending channel, which, if remains within the channel, supports the bullish trend.
The 14-day Relative Strength Index (RSI) is slightly below 70 level, confirming the ongoing bullish sentiment is in play. However, a move above the 70 mark would suggest overbought conditions and signal a potential downward correction.
On the upside, if USD/CAD remains within the ascending channel, it could explore the region around the upper boundary around 1.3870. A break above this level could strengthen bullish momentum, potentially driving the pair toward 1.3946, its highest point since October 2022.
In terms of the support, a decisive break below the lower boundary of the ascending channel at the 1.3790 level, could weaken bullish sentiment, pushing the USD/CAD pair to target its nine-day Exponential Moving Average (EMA) at 1.3718.
Further support is found at the former resistance, now acting as support, around 1.3620, with the key psychological level of 1.3600 just below.
USD/CAD: Daily Chart
Canadian Dollar PRICE Today
The table below shows the percentage change of Canadian Dollar (CAD) against listed major currencies today. Canadian Dollar was the weakest against the Swiss Franc.
| USD | EUR | GBP | JPY | CAD | AUD | NZD | CHF | |
|---|---|---|---|---|---|---|---|---|
| USD | -0.00% | 0.46% | 0.12% | 0.08% | 0.18% | 0.16% | -0.06% | |
| EUR | 0.00% | 0.47% | 0.13% | 0.10% | 0.20% | 0.19% | -0.10% | |
| GBP | -0.46% | -0.47% | -0.37% | -0.35% | -0.27% | -0.27% | -0.50% | |
| JPY | -0.12% | -0.13% | 0.37% | -0.02% | 0.06% | 0.05% | -0.15% | |
| CAD | -0.08% | -0.10% | 0.35% | 0.02% | 0.09% | 0.08% | -0.15% | |
| AUD | -0.18% | -0.20% | 0.27% | -0.06% | -0.09% | -0.01% | -0.24% | |
| NZD | -0.16% | -0.19% | 0.27% | -0.05% | -0.08% | 0.00% | -0.23% | |
| CHF | 0.06% | 0.10% | 0.50% | 0.15% | 0.15% | 0.24% | 0.23% |
The heat map shows percentage changes of major currencies against each other. The base currency is picked from the left column, while the quote currency is picked from the top row. For example, if you pick the Canadian Dollar from the left column and move along the horizontal line to the US Dollar, the percentage change displayed in the box will represent CAD (base)/USD (quote).
Author

Akhtar Faruqui
FXStreet
Akhtar Faruqui is a Forex Analyst based in New Delhi, India. With a keen eye for market trends and a passion for dissecting complex financial dynamics, he is dedicated to delivering accurate and insightful Forex news and analysis.