USD/CAD Price Forecast: Tests initial support near 1.3950, followed by nine-day EMA
- USD/CAD may find initial resistance at its six-week high of 1.4016.
- The 14-day RSI remains slightly above 50, indicating continued bullish bias.
- The immediate support appears at the nine-day EMA of 1.3936.

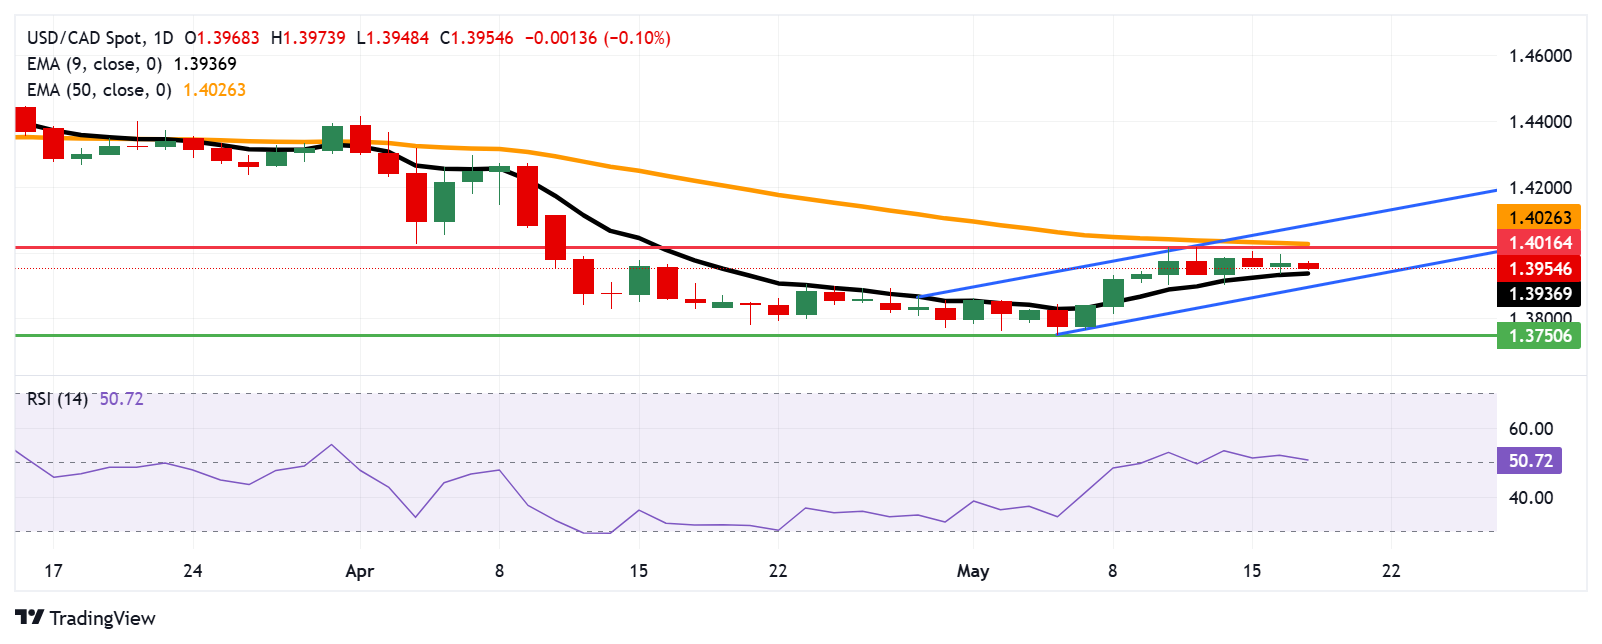
The USD/CAD pair is losing ground after registering gains in the previous session, trading around 1.3950 during the European hours on Monday. The daily chart's technical analysis suggested a sustained bullish sentiment, as the pair continues to trade within the ascending channel pattern.
The 14-day Relative Strength Index (RSI) remains just above 50, indicating continued bullish pressure. Additionally, the USD/CAD pair is also remaining above the nine-day Exponential Moving Average (EMA), pointing to stronger short-term momentum.
The USD/CAD pair may encounter resistance at its six-week high of 1.4016, which was reached on May 13, followed by the 50-day Exponential Moving Average (EMA) at 1.4023. A break above this crucial resistance zone could improve the medium-term price momentum and support the pair to test the upper boundary of the ascending channel around 1.4100.
On the downside, the USD/CAD pair may find immediate support at the nine-day EMA of 1.3936, followed by the ascending channel’s lower boundary around the psychological level of 1.3900. A break below this crucial support zone would weaken the short-term price momentum and support the pair to navigate the region around the seven-month low of 1.3750, last seen on May 6.
USD/CAD: Daily Chart
Canadian Dollar PRICE Today
The table below shows the percentage change of Canadian Dollar (CAD) against listed major currencies today. Canadian Dollar was the strongest against the US Dollar.
| USD | EUR | GBP | JPY | CAD | AUD | NZD | CHF | |
|---|---|---|---|---|---|---|---|---|
| USD | -0.78% | -0.54% | -0.26% | -0.13% | -0.33% | -0.18% | -0.35% | |
| EUR | 0.78% | -0.01% | 0.34% | 0.49% | 0.34% | 0.43% | 0.20% | |
| GBP | 0.54% | 0.01% | 0.06% | 0.50% | 0.35% | 0.44% | 0.21% | |
| JPY | 0.26% | -0.34% | -0.06% | 0.14% | 0.09% | 0.28% | -0.04% | |
| CAD | 0.13% | -0.49% | -0.50% | -0.14% | -0.20% | -0.06% | -0.29% | |
| AUD | 0.33% | -0.34% | -0.35% | -0.09% | 0.20% | 0.09% | -0.13% | |
| NZD | 0.18% | -0.43% | -0.44% | -0.28% | 0.06% | -0.09% | -0.23% | |
| CHF | 0.35% | -0.20% | -0.21% | 0.04% | 0.29% | 0.13% | 0.23% |
The heat map shows percentage changes of major currencies against each other. The base currency is picked from the left column, while the quote currency is picked from the top row. For example, if you pick the Canadian Dollar from the left column and move along the horizontal line to the US Dollar, the percentage change displayed in the box will represent CAD (base)/USD (quote).
Author

Akhtar Faruqui
FXStreet
Akhtar Faruqui is a Forex Analyst based in New Delhi, India. With a keen eye for market trends and a passion for dissecting complex financial dynamics, he is dedicated to delivering accurate and insightful Forex news and analysis.


