- USD/CAD meets with a fresh supply on Thursday amid a modest USD downtick.
- Sliding Oil prices seem to undermine the Loonie and lend support to the major.
- Traders also seem reluctant ahead of the US PPI and Fed Chair Powell’s speech.
The USD/CAD pair struggles to capitalize on the previous day's goodish rebound from the 1.3900 mark and attracts fresh sellers during the Asian session on Thursday. Spot prices, however, lack bearish conviction and currently trade around the 1.3865 area, down less than 0.10% for the day.
The US Dollar (USD) bulls remain on the sidelines ahead of the US Producer Price Index (PPI) and Federal Reserve (Fed) Jerome Powell's appearance, which, in turn, is seen as a key factor weighing on the USD/CAD pair. However, a further decline in Crude Oil prices for the second straight day undermines the commodity-linked loonie and acts as a tailwind for the currency pair.
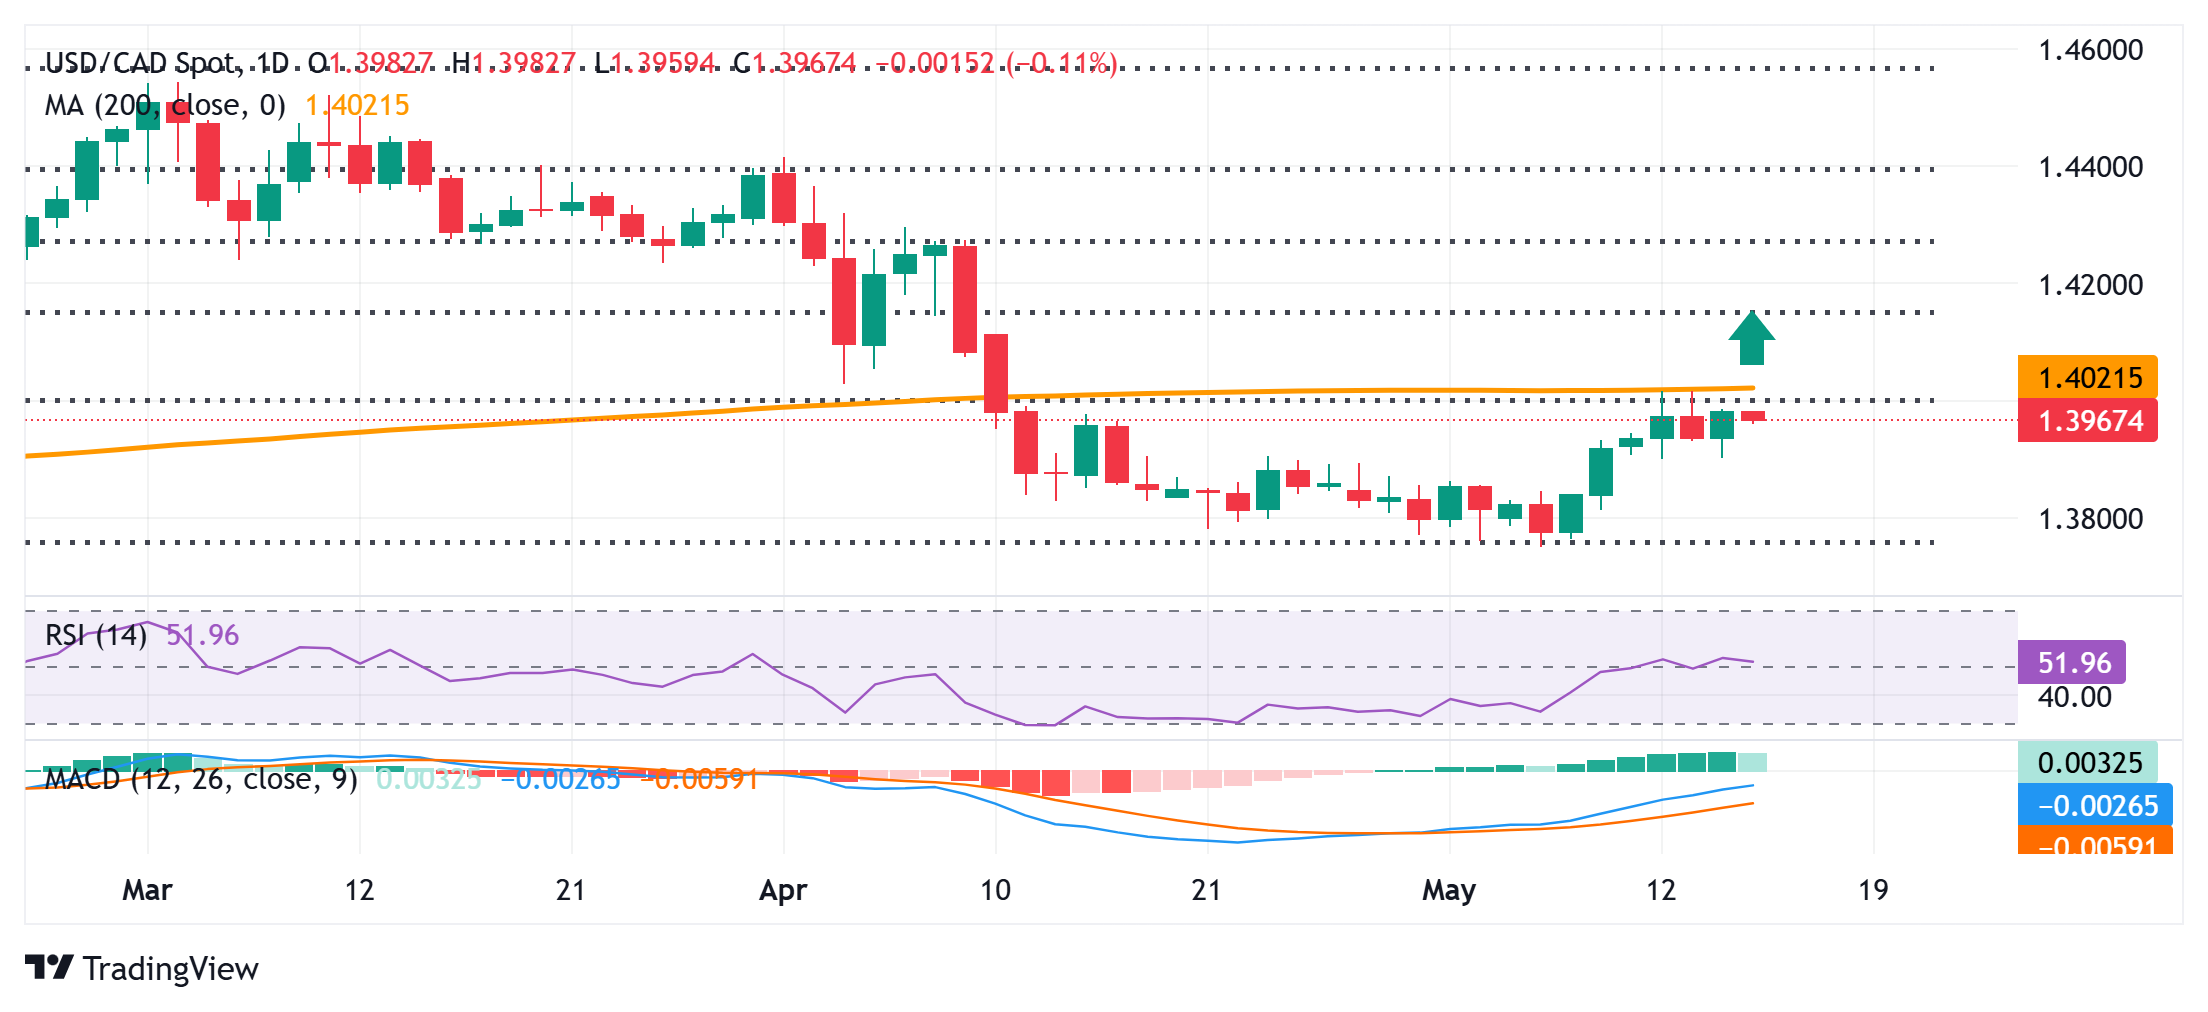
From a technical perspective, oscillators on the daily chart have started gaining positive traction and suggest that any subsequent slide might still be seen as a buying opportunity near the 1.3935 area. This should limit the downside for the USD/CAD pair near the 1.3900 mark. A convincing break below the latter, however, might shift the bias in favor of bearish traders.
Against the backdrop of this week's failure near the 1.4000 confluence (comprising the 200-day Simple Moving Average (SMA) and the 23.6% Fibonacci retracement level of the March-May fall), the USD/CAD pair might then weaken to the 1.3855 region. The downward trajectory could extend towards the 1.3800 mark en route to the year-to-date low, around the 1.3750 area.
On the flip side, a sustained strength and acceptance above the 1.4000 round figure could lift the USD/CAD pair beyond the 1.4050 intermediate hurdle, towards the 1.4100 neighborhood. Some follow-through buying would pave the way for a move towards the 1.4100 mark en route to the 1.4145-1.4150 region, or the 38.2% Fibo. level.
USD/CAD daily chart

Economic Indicator
Producer Price Index (YoY)
The Producer Price Index released by the Bureau of Labor statistics, Department of Labor measures the average changes in prices in primary markets of the US by producers of commodities in all states of processing. Changes in the PPI are widely followed as an indicator of commodity inflation. Generally speaking, a high reading is seen as positive (or bullish) for the USD, whereas a low reading is seen as negative (or bearish).
Read more.Next release: Thu May 15, 2025 12:30
Frequency: Monthly
Consensus: 2.5%
Previous: 2.7%
Source: US Bureau of Labor Statistics
Information on these pages contains forward-looking statements that involve risks and uncertainties. Markets and instruments profiled on this page are for informational purposes only and should not in any way come across as a recommendation to buy or sell in these assets. You should do your own thorough research before making any investment decisions. FXStreet does not in any way guarantee that this information is free from mistakes, errors, or material misstatements. It also does not guarantee that this information is of a timely nature. Investing in Open Markets involves a great deal of risk, including the loss of all or a portion of your investment, as well as emotional distress. All risks, losses and costs associated with investing, including total loss of principal, are your responsibility. The views and opinions expressed in this article are those of the authors and do not necessarily reflect the official policy or position of FXStreet nor its advertisers. The author will not be held responsible for information that is found at the end of links posted on this page.
If not otherwise explicitly mentioned in the body of the article, at the time of writing, the author has no position in any stock mentioned in this article and no business relationship with any company mentioned. The author has not received compensation for writing this article, other than from FXStreet.
FXStreet and the author do not provide personalized recommendations. The author makes no representations as to the accuracy, completeness, or suitability of this information. FXStreet and the author will not be liable for any errors, omissions or any losses, injuries or damages arising from this information and its display or use. Errors and omissions excepted.
The author and FXStreet are not registered investment advisors and nothing in this article is intended to be investment advice.
Recommended content
Editors’ Picks

EUR/USD retreats from multi-year tops past 1.1600
On Thursday, the EUR/USD extended its uptrend and reached its highest level since November 2021, north of 1.1600 the figure. The marked advance in the pair came in response to the pronounced decline in the US Dollar, aggravated after poor results from the US labour market and softer producer prices.

GBP/USD keeps the bid bias intact around 1.3600
Following an initial dip to the 1.3520 zone, the GBP/USD regained traction and traded over the 1.3600 mark on Thursday, building on Wednesday’s gains. The US Dollar (USD) is under heavy selling pressure following weaker inflation data and disappointing jobless claims number.

Gold remains strong around $3,400
Gold maintains its weekly rebound well in place, now trading near the $3,400 mark per troy ounce following a strong retracement in the US Dollar, declining US yields across the curve and growing geopolitical tensions.

Cardano Price Forecast: Whales acquire 310 million ADA amid potential triangle breakout
Cardano (ADA) shows weakness as it reverses from an overhead trendline of a triangle pattern. The altcoin edges lower by over 1% at press time on Thursday, fueling a steeper correction in its Open Interest. Amid weakness, Cardano whales have acquired 310 million ADA tokens so far this month, projecting increased confidence as the triangle pattern nears resolution.

US tariffs here to stay, trade deals ‘largely symbolic’
Despite legal challenges to IEEPA tariffs, US trade policy remains firm. Tariffs on steel and aluminium have doubled, and new sectoral tariffs are expected. Trade deals may emerge, but most will be symbolic. Effective tariff rates will stay high throughout 2025.