USD/CAD Price Forecast: Hovers around the ascending channel’s upper boundary at 1.4400
- USD/CAD tests the immediate resistance at the ascending channel’s upper boundary of 1.4400 level.
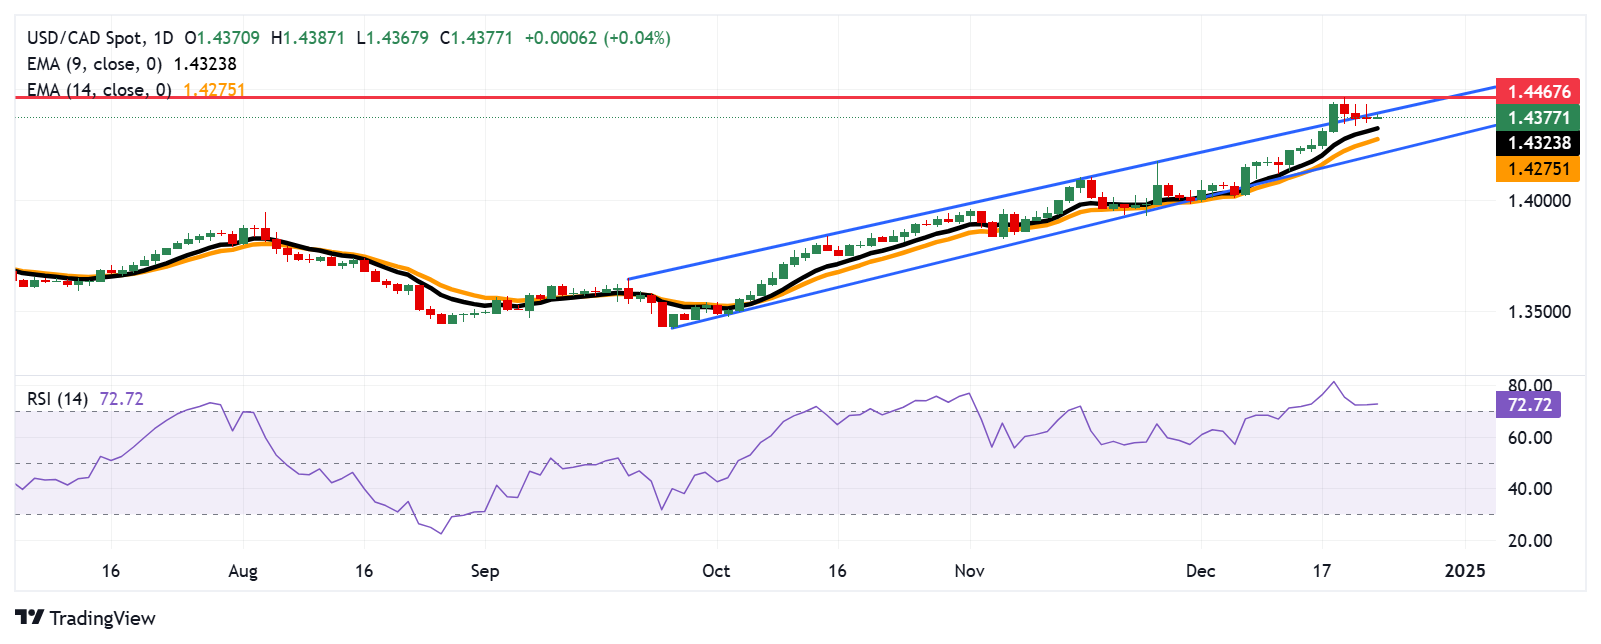
- The bullish bias is reinforced as the 14-day RSI remains above the 70 mark.
- The nine-day EMA at the 1.4323 level would act as initial support for the pair.

USD/CAD breaks its three-day losing streak, trading around 1.4380 during the European session on Tuesday. From a technical standpoint, the daily chart suggests that the USD/CAD pair is testing the upper boundary of an ascending channel, indicating a strengthening bullish bias.
The 14-day Relative Strength Index (RSI) remains above the 70 level, signaling an overbought condition and the possibility of a downward correction. However, if the RSI holds near this level, it could reinforce bullish sentiment.
Moreover, the USD/CAD pair continues to trade above the nine- and 14-day Exponential Moving Averages (EMA), highlighting a bullish trend and strong short-term price momentum. This alignment reflects robust buying interest and the potential for further upside movement.
On the upside, the USD/CAD pair attempts to reclaim and break above the immediate resistance at the ascending channel’s upper boundary of the 1.4400 level. A decisive breach above this channel would reinforce the bullish bias and open the door for a potential retest of the multi-year high at 1.4467 level, which was marked on December 19.
Regarding support, the USD/CAD pair could first test the nine-day EMA at the 1.4323 level, followed by the 14-day EMA at the 1.4274 level. Further support appears at the lower boundary of the ascending channel at 1.4210 level.
USD/CAD: Daily Chart
Canadian Dollar PRICE Today
The table below shows the percentage change of Canadian Dollar (CAD) against listed major currencies today. Canadian Dollar was the strongest against the Swiss Franc.
| USD | EUR | GBP | JPY | CAD | AUD | NZD | CHF | |
|---|---|---|---|---|---|---|---|---|
| USD | 0.12% | -0.01% | -0.06% | 0.05% | 0.07% | 0.03% | 0.15% | |
| EUR | -0.12% | -0.12% | -0.20% | -0.07% | -0.04% | -0.07% | 0.03% | |
| GBP | 0.00% | 0.12% | -0.06% | 0.06% | 0.09% | 0.06% | 0.15% | |
| JPY | 0.06% | 0.20% | 0.06% | 0.14% | 0.19% | 0.13% | 0.25% | |
| CAD | -0.05% | 0.07% | -0.06% | -0.14% | 0.02% | 0.00% | 0.09% | |
| AUD | -0.07% | 0.04% | -0.09% | -0.19% | -0.02% | -0.02% | 0.07% | |
| NZD | -0.03% | 0.07% | -0.06% | -0.13% | -0.00% | 0.02% | 0.09% | |
| CHF | -0.15% | -0.03% | -0.15% | -0.25% | -0.09% | -0.07% | -0.09% |
The heat map shows percentage changes of major currencies against each other. The base currency is picked from the left column, while the quote currency is picked from the top row. For example, if you pick the Canadian Dollar from the left column and move along the horizontal line to the US Dollar, the percentage change displayed in the box will represent CAD (base)/USD (quote).
Author

Akhtar Faruqui
FXStreet
Akhtar Faruqui is a Forex Analyst based in New Delhi, India. With a keen eye for market trends and a passion for dissecting complex financial dynamics, he is dedicated to delivering accurate and insightful Forex news and analysis.