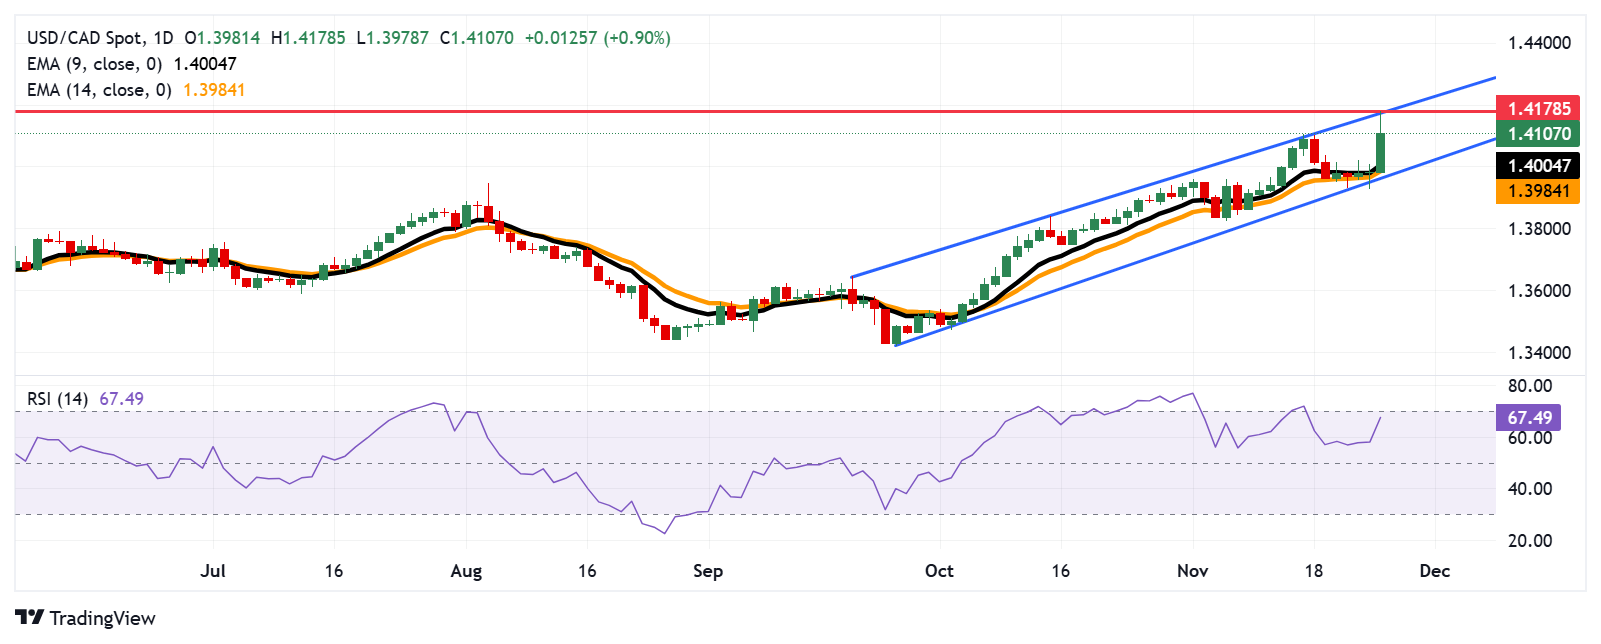
USD/CAD Price Forecast: Finds support near 1.4100 after pulling back from multi-year highs
- The USD/CAD rose more than 1% to 1.4178, a level not seen since April 2020.
- A corrective pullback could be triggered if the 14-day RSI breaks above the 70 mark.
- The pair may find primary supports at the nine- and 14-day EMAs.

USD/CAD extended its winning streak for the third consecutive session and rose more than 1% to 1.4178, a level not seen since April 2020. At the time of writing, the pair trades near 1.4110 during Tuesday's European session. From a technical perspective, the daily chart analysis shows the pair trending higher within an ascending channel, suggesting a strengthening bullish bias.
The 14-day Relative Strength Index (RSI) is just below the 70 level, confirming ongoing bullish momentum. However, a break above 70 would signal an overbought condition and could prompt a corrective pullback.
Additionally, the USD/CAD pair has breached above both the 14- and nine-day Exponential Moving Averages (EMA), signaling a bullish outlook and indicating strengthening short-term price momentum. This suggests strong buying interest and the potential for further price gains.
Regarding its resistance, the USD/CAD pair may attempt to re-approach its recent high of 1.4178, a level last seen in April 2020, which also aligns with the upper boundary of the ascending channel.
In terms of support, the USD/CAD pair could initially test the nine-day EMA at the 1.4000 level, followed by the 14-day EMA at 1.3984. Additional support may be found around the lower boundary of the ascending channel at 1.3960.
USD/CAD: Daily Chart
Canadian Dollar PRICE Today
The table below shows the percentage change of Canadian Dollar (CAD) against listed major currencies today. Canadian Dollar was the weakest against the Euro.
| USD | EUR | GBP | JPY | CAD | AUD | NZD | CHF | |
|---|---|---|---|---|---|---|---|---|
| USD | -0.10% | 0.05% | -0.08% | 0.90% | 0.26% | 0.10% | -0.00% | |
| EUR | 0.10% | 0.15% | 0.03% | 1.00% | 0.36% | 0.20% | 0.10% | |
| GBP | -0.05% | -0.15% | -0.10% | 0.84% | 0.22% | 0.05% | -0.06% | |
| JPY | 0.08% | -0.03% | 0.10% | 0.97% | 0.32% | 0.15% | 0.06% | |
| CAD | -0.90% | -1.00% | -0.84% | -0.97% | -0.63% | -0.80% | -0.90% | |
| AUD | -0.26% | -0.36% | -0.22% | -0.32% | 0.63% | -0.17% | -0.27% | |
| NZD | -0.10% | -0.20% | -0.05% | -0.15% | 0.80% | 0.17% | -0.10% | |
| CHF | 0.00% | -0.10% | 0.06% | -0.06% | 0.90% | 0.27% | 0.10% |
The heat map shows percentage changes of major currencies against each other. The base currency is picked from the left column, while the quote currency is picked from the top row. For example, if you pick the Canadian Dollar from the left column and move along the horizontal line to the US Dollar, the percentage change displayed in the box will represent CAD (base)/USD (quote).
Author

Akhtar Faruqui
FXStreet
Akhtar Faruqui is a Forex Analyst based in New Delhi, India. With a keen eye for market trends and a passion for dissecting complex financial dynamics, he is dedicated to delivering accurate and insightful Forex news and analysis.