USD/CAD Price Forecast: Falls to near 1.3550, 15-month lows
- USD/CAD may target initial support at 1.3539, its lowest level since October 2024.
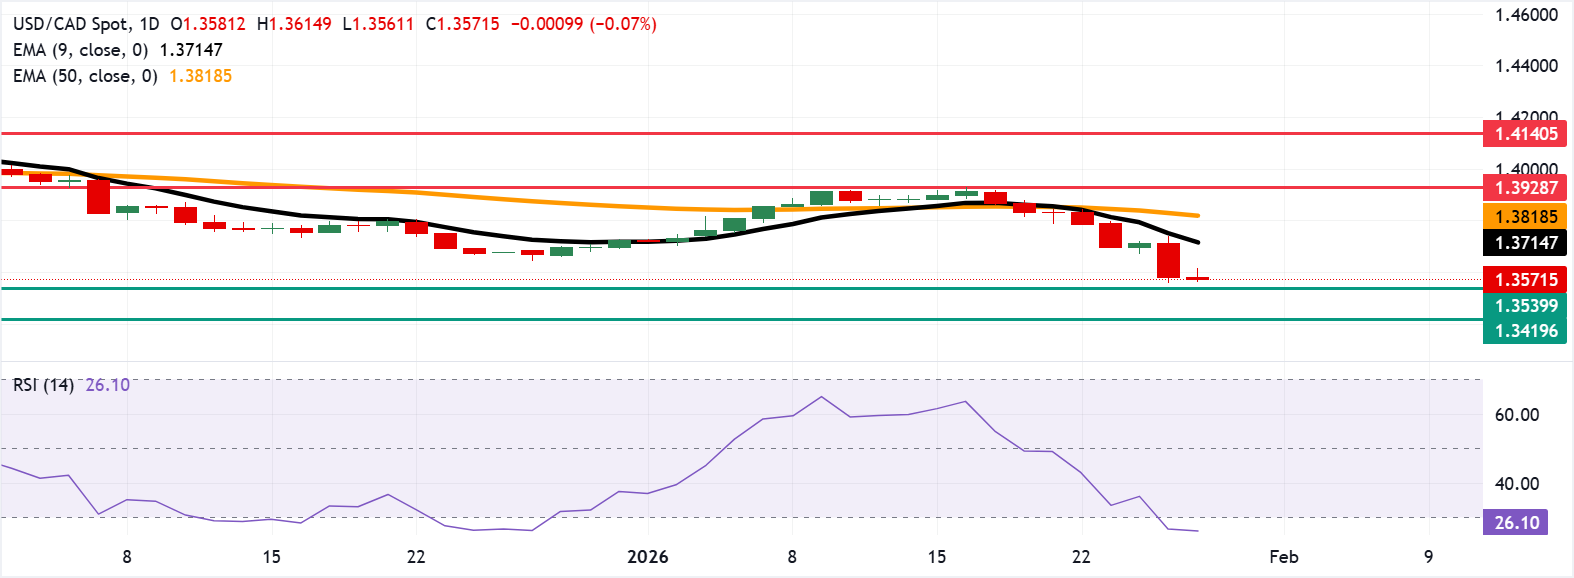
- The 14-day Relative Strength Index at 26 signals oversold conditions and heavy selling pressure.
- The primary resistance sits at the nine-day EMA 1.3716.

USD/CAD moves little after registering nearly 1% losses in the previous session, trading around 1.3570 during the European hours on Wednesday. The technical analysis of the daily chart shows the pair extends below the falling nine-day Exponential Moving Average (EMA) at 1.3715 and the 50-day EMA at 1.3818, maintaining a bearish tone.
The short-term average tracks beneath the medium-term gauge, reinforcing downside risk. Below the nine-day EMA and 50-day EMA, rallies would remain capped, and the trend favors lower highs.
The 14-day Relative Strength Index (RSI) is at 26 (oversold), which warns of stretched selling pressure, though an uptick back above 30 could trigger a brief pause. Momentum remains weak with RSI sub-30, so rebounds could be corrective rather than trend-changing.
The USD/CAD pair may target the initial support at 1.3539, the lowest since October 2024. Further decline will expose the next support at 1.3419, the lowest since February 2024.
On the upside, the primary resistance lies at the nine-day EMA of 1.3716, followed by the 50-day EMA at 1.3818. A break above these averages would cause the emergence of a bullish bias and support the USD/CAD pair to target the seven-week high of 1.3928, reached on January 16.
(The technical analysis of this story was written with the help of an AI tool.)
Canadian Dollar Price Today
The table below shows the percentage change of Canadian Dollar (CAD) against listed major currencies today. Canadian Dollar was the strongest against the Swiss Franc.
| USD | EUR | GBP | JPY | CAD | AUD | NZD | CHF | |
|---|---|---|---|---|---|---|---|---|
| USD | 0.44% | 0.43% | 0.24% | -0.07% | 0.17% | 0.29% | 0.71% | |
| EUR | -0.44% | -0.01% | -0.22% | -0.51% | -0.27% | -0.15% | 0.26% | |
| GBP | -0.43% | 0.01% | -0.19% | -0.49% | -0.26% | -0.14% | 0.28% | |
| JPY | -0.24% | 0.22% | 0.19% | -0.29% | -0.05% | 0.07% | 0.49% | |
| CAD | 0.07% | 0.51% | 0.49% | 0.29% | 0.24% | 0.36% | 0.78% | |
| AUD | -0.17% | 0.27% | 0.26% | 0.05% | -0.24% | 0.13% | 0.53% | |
| NZD | -0.29% | 0.15% | 0.14% | -0.07% | -0.36% | -0.13% | 0.41% | |
| CHF | -0.71% | -0.26% | -0.28% | -0.49% | -0.78% | -0.53% | -0.41% |
The heat map shows percentage changes of major currencies against each other. The base currency is picked from the left column, while the quote currency is picked from the top row. For example, if you pick the Canadian Dollar from the left column and move along the horizontal line to the US Dollar, the percentage change displayed in the box will represent CAD (base)/USD (quote).
Author

Akhtar Faruqui
FXStreet
Akhtar Faruqui is a Forex Analyst based in New Delhi, India. With a keen eye for market trends and a passion for dissecting complex financial dynamics, he is dedicated to delivering accurate and insightful Forex news and analysis.


