Avalanche Price Forecast: AVAX holds near $12 as spot ETF debuts on Nasdaq lifts bullish sentiment
- Avalanche steadies around $12 on Wednesday after rebounding from the lower boundary of the horizontal parallel channel.
- VanEck’s spot AVAX ETF was listed on Nasdaq on Monday, boosting bullish sentiment.
- On-chain and derivatives data back a rally, with large whale orders rising, cooling conditions, and increasing open interest.

Avalanche (AVAX) price holds above $12 at the time of writing on Wednesday, after rebounding from the lower boundary of its horizontal parallel channel, signaling early signs of stabilization. The launch of Avalanche spot Exchange Traded Funds (ETFs) by VanEck this week on Nasdaq signals improving market sentiment. In addition, supportive on-chain and derivatives data for AVAX suggest a potential recovery if bullish momentum builds.
Launch of spot ETFs
US asset manager VanEck announced on Monday the addition of a spot Avalanche ETF (VAVX) to its lineup of digital asset-focused ETFs. AVAX rose 2% that day following this announcement and continued its gains by 3.5% the next day.
This development is bullish for AVAX’s long-term price, as it allows investors to gain exposure without directly holding AVAX while also enhancing liquidity, legitimacy, and overall adoption.
AVAX’s bullish on-chain and derivatives data
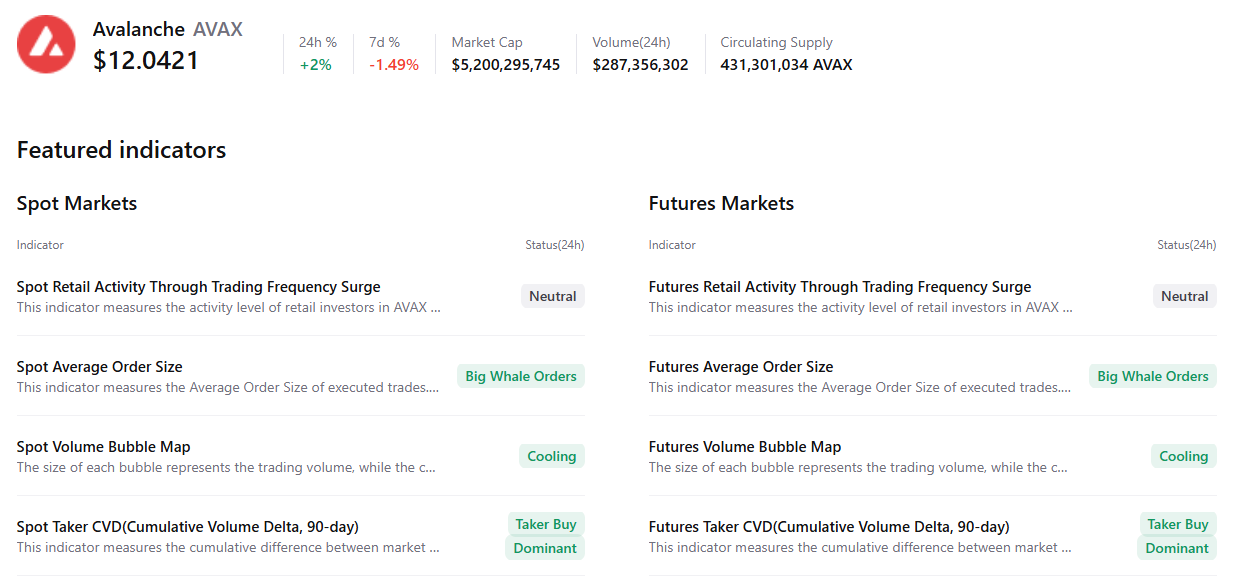
CryptoQuant’s summary data supports the bullish outlook, as AVAX’s spot and futures markets show large whale orders, cooling conditions, and buy dominance. All these factors suggest that AVAX may be positioning for a potential recovery in the coming days.
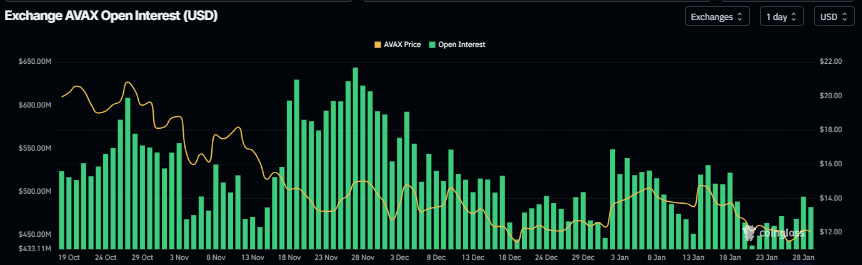
On the derivatives side, CoinGlass’ data shows that the futures Open Interest (OI) in Avalanche at exchanges reached $494.08 million on Wednesday, up from $437.49 million on January 21 and has been rising steadily. An increasing OI represents new or additional money entering the market and new buying, which could fuel the current AVAX price rally.
Avalanche Price Forecast: AVAX rebounds after retesting key support
Avalanche price retested and found support around the lower boundary of the horizontal channel pattern at $11.28 on Sunday, and rose nearly 6% in the next two days. As of writing on Wednesday, AVAX is trading at $12.06.
If AVAX continues its recovery, it could extend the rally toward the midpoint of the pattern at $13.38, which coincides with the 50-day Exponential Moving Average (EMA). A close above this level could extend gains toward the upper boundary at $15.06.
The Relative Strength Index (RSI) on the daily chart is 41, pointing upward toward the neutral 50 level, indicating fading bearish momentum. For the recovery rally to be sustained, the RSI must move above the neutral level. In addition, the Moving Average Convergence Divergence (MACD) lines are converging, with fading red histogram levels below the zero line, further supporting the potential recovery thesis.
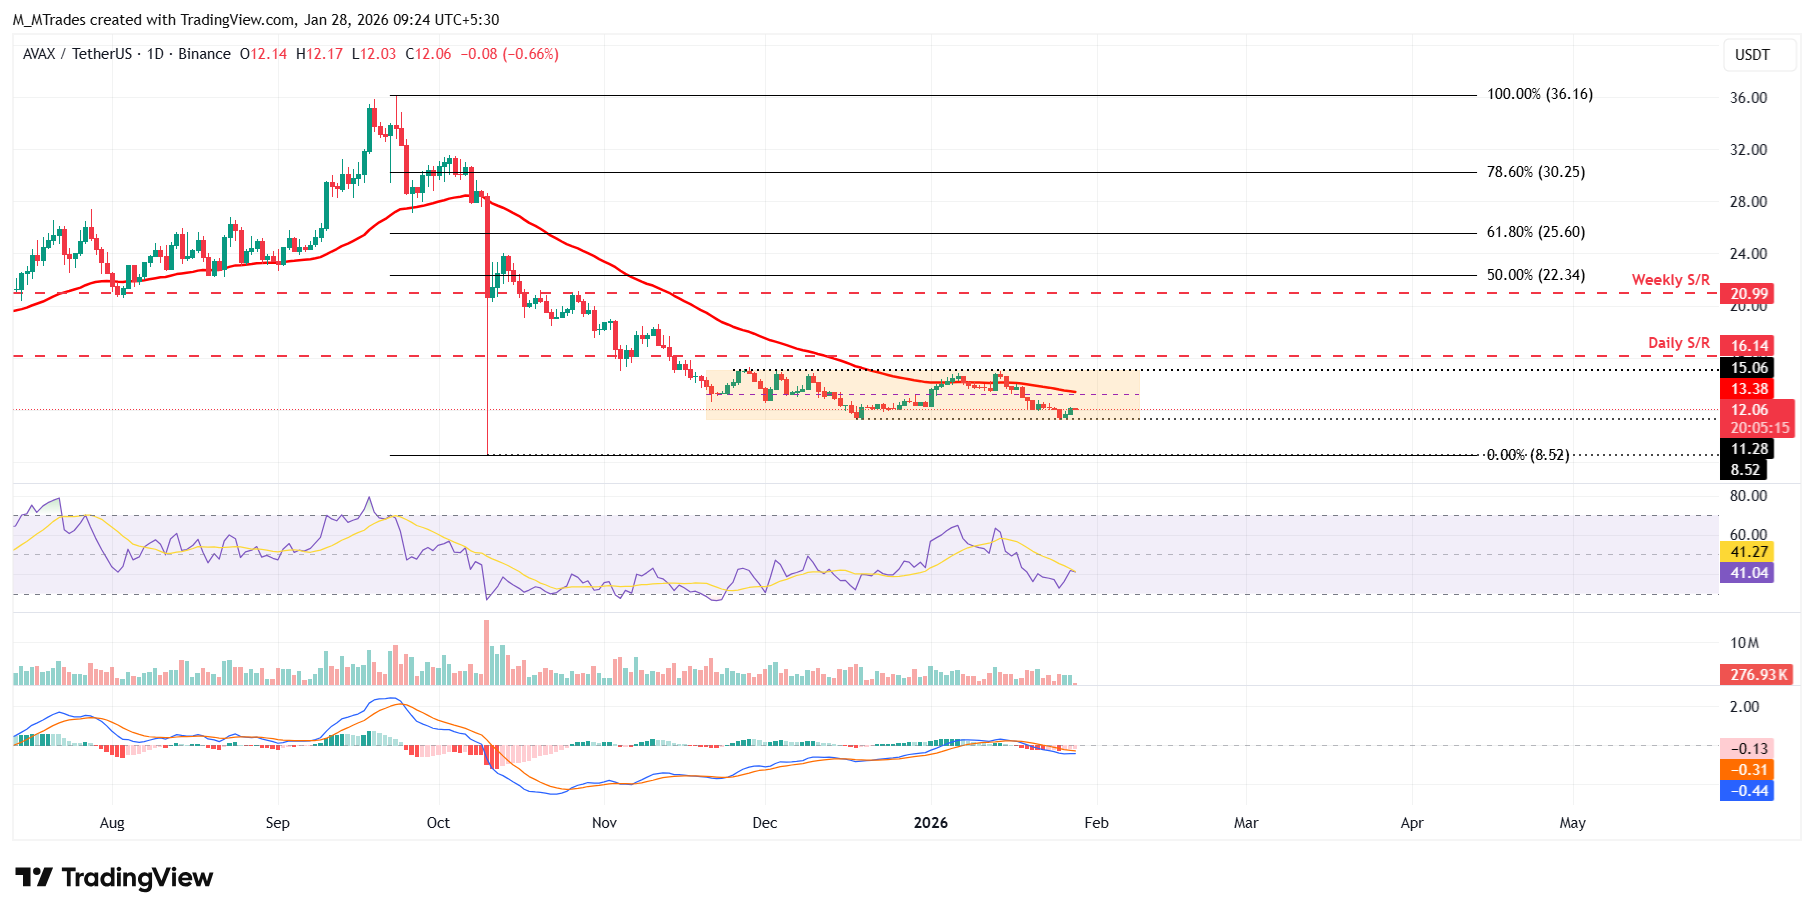
On the other hand, if AVAX faces a correction, it could extend the decline toward the lower boundary of the horizontal channel pattern at $11.28.
Author

Manish Chhetri
FXStreet
Manish Chhetri is a crypto specialist with over four years of experience in the cryptocurrency industry.



