USD/CAD Price Analysis: The hourly 61.8% golden ratio is eyed for the opening sessions
- USD/CAD is correcting from daily resistance and 1.2530s are eyed.
- A deeper correction can move to 1.25 the figure.

As per the prior series of analyses for USD/CAD, USD/CAD Price Analysis: Bulls moving in for the kill, 38.2% Fibo 1.2550 eyed, the price has continued to track a typical price action path and is pressuring the 1.2550s as forecasted.
USD/CAD prior analysis
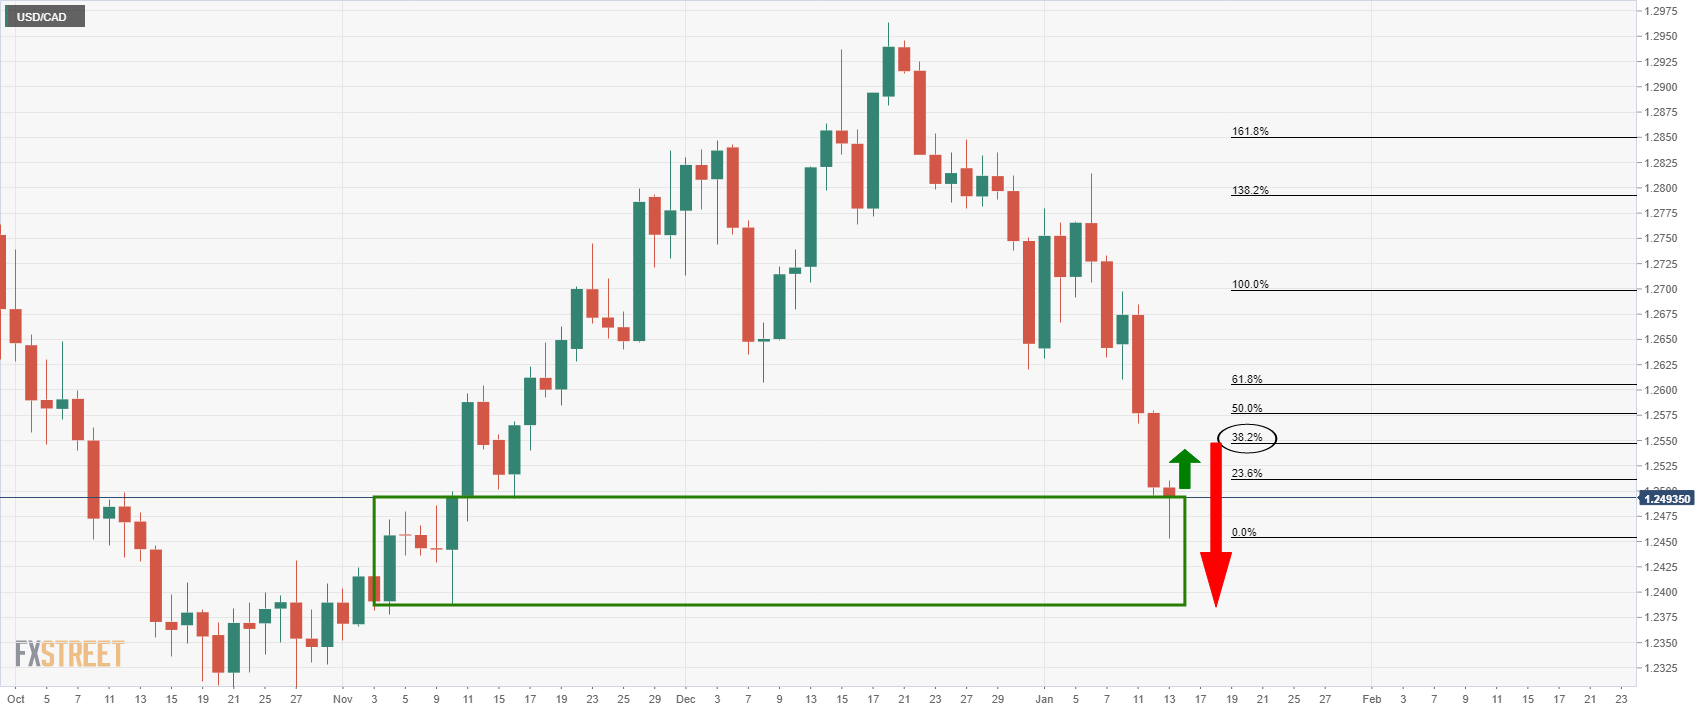
At the time of the prior analysis, the daily chart showed that the price had run into an area of demand and had stalled. This exposed the 38.2% Fibonacci retracement level near 1.2550 for the current week.
The price has reached the target area:
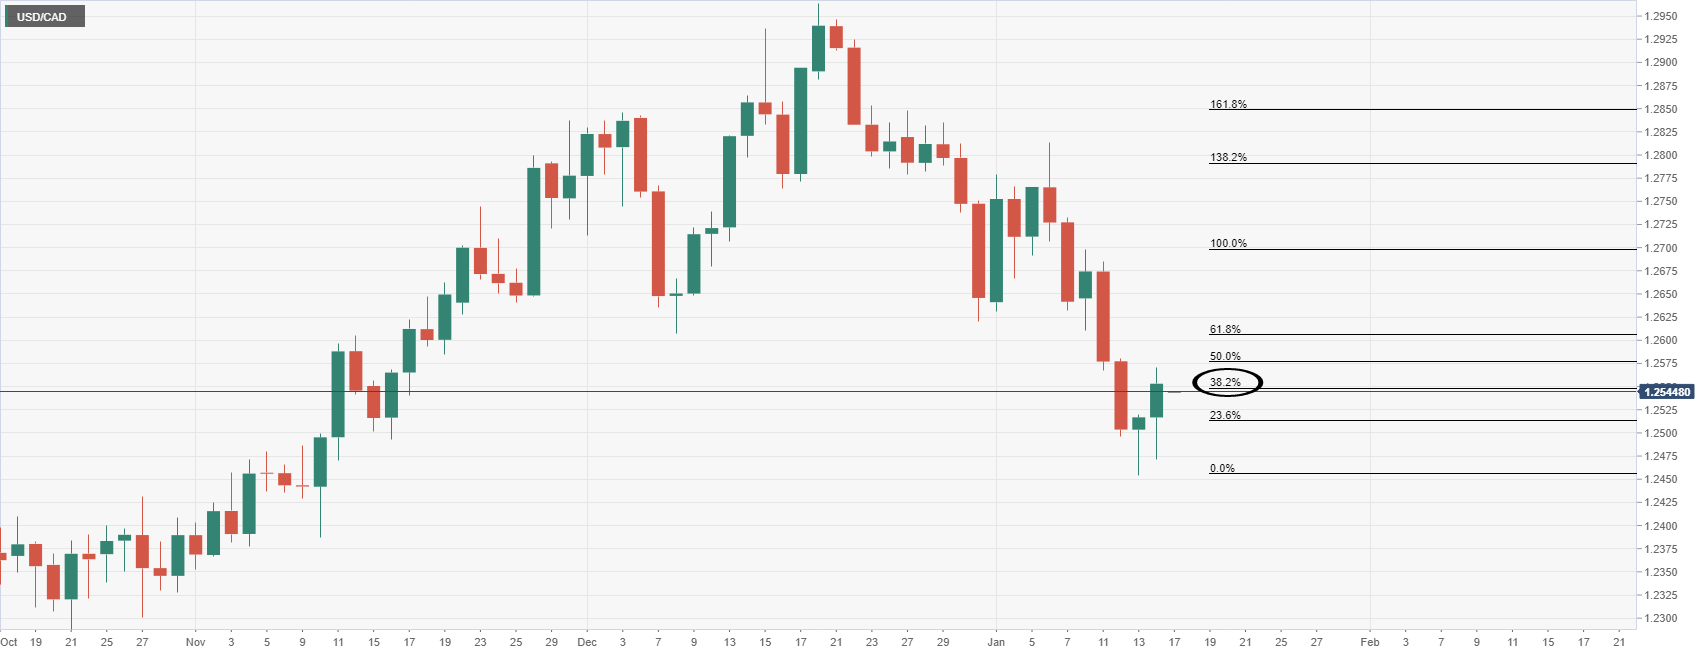
At this juncture, bulls will be looking for a discount and for a bullish structure to mount towards a deeper retracement of the daily bearish impulse and through the current layer of resistance.
USD/CAD 4-hour chart
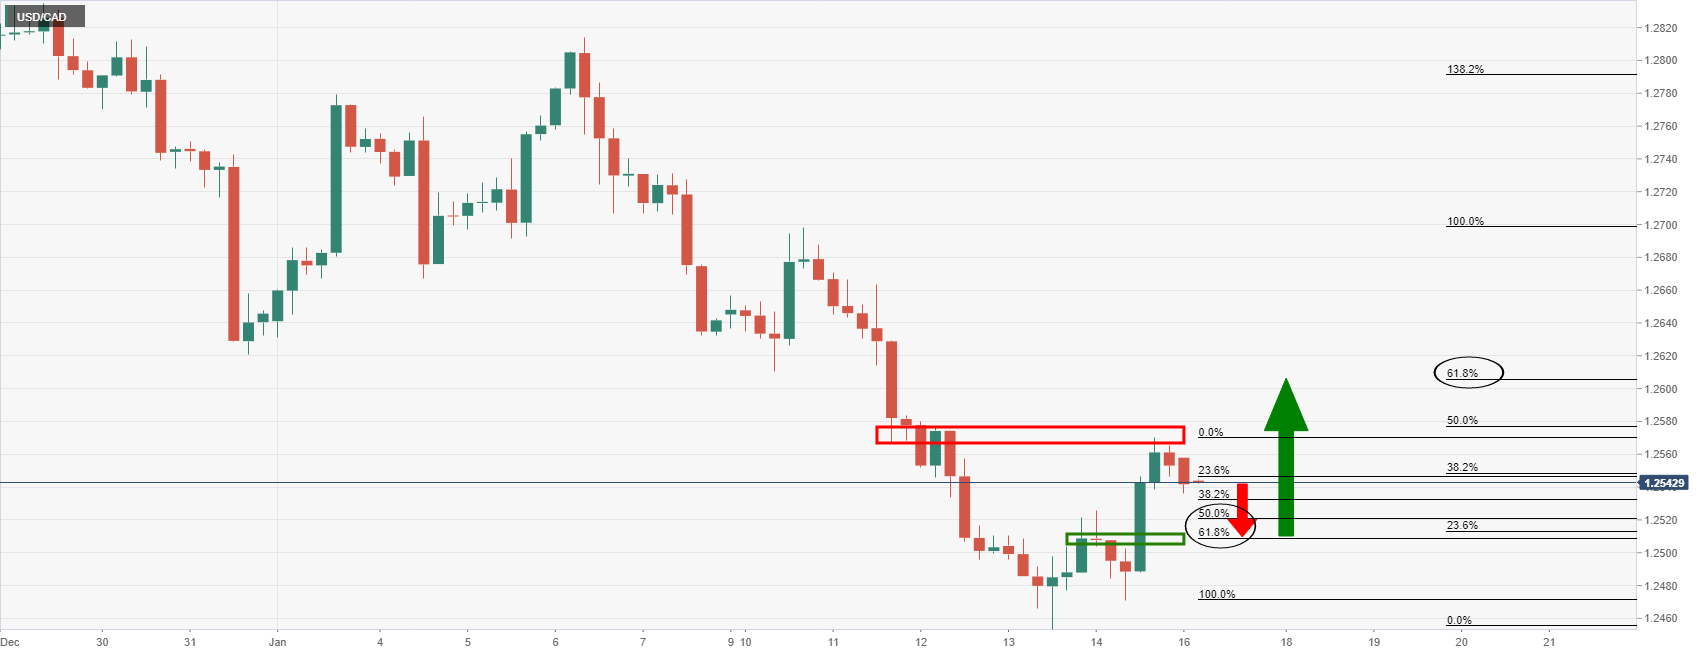
The 4-hour chart is showing that the price is meeting the 4-hour resistance structure and is being rejected. This could give rise to a deeper correction into the prior resistance that has a confluence of the 61.8% ratio at 1.25 the figure, or at least to the 50% mean reversion mark as illustrated above near 1.2520.
USD/CAD H1 chart
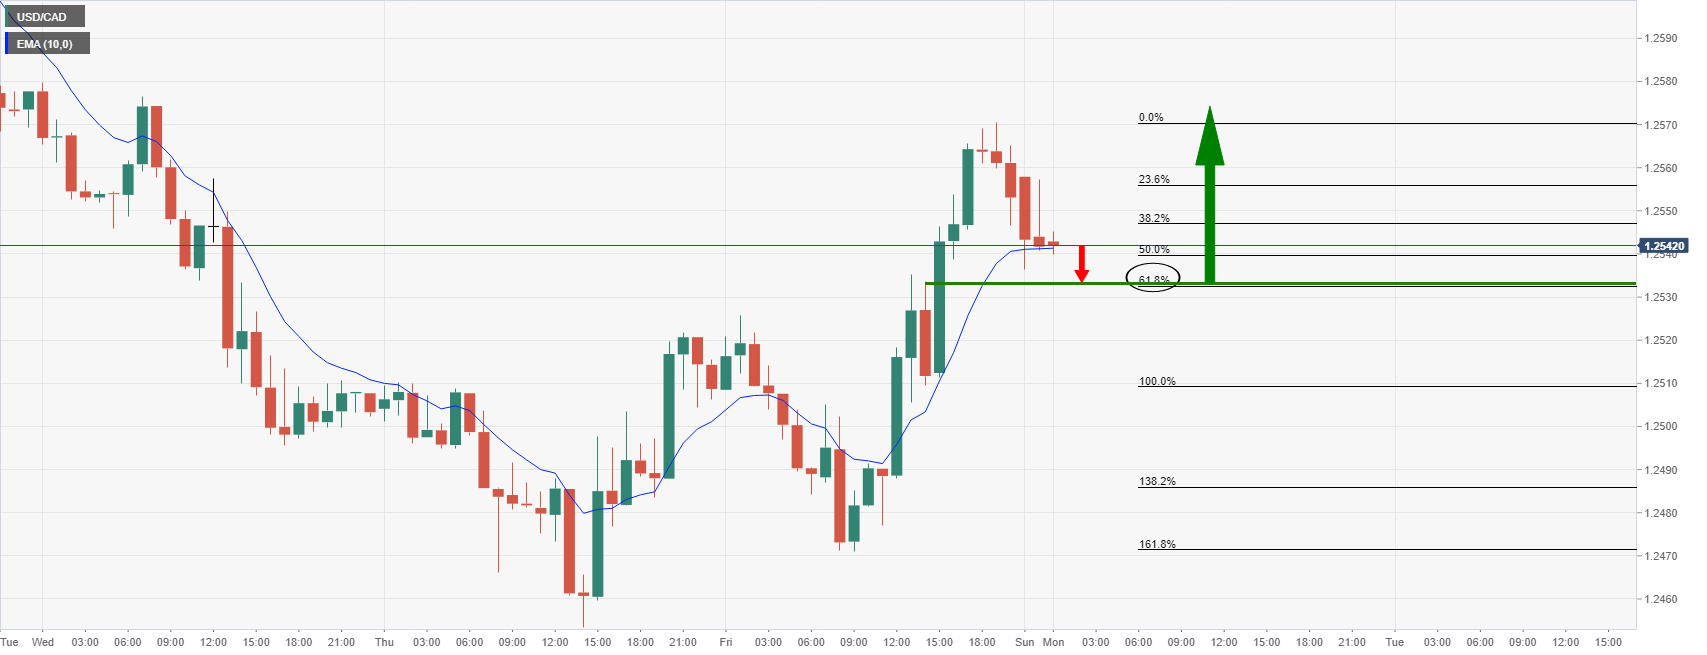
The hourly chart, however, shows structure higher up which will need to be overcome first near 1.2530.
Author

Ross J Burland
FXStreet
Ross J Burland, born in England, UK, is a sportsman at heart. He played Rugby and Judo for his county, Kent and the South East of England Rugby team.