USD/CAD Price Analysis: The 61.8% golden ratio could come under pressure
- USD/CAD bulls are seeking a bullish continuation for the days ahead.
- The daily Fibonacci retracements levels are under pressure.

The price of USD/CAD has so far corrected to test the 38.2% Fibonacci retracement and on towards the 50% mean reversion mark near 1.2495. 1.2486 is where the November 9 highs are, which could be tested as well, in line with the 61.8% Fibo, aka the golden ratio.
USD/CAD daily chart
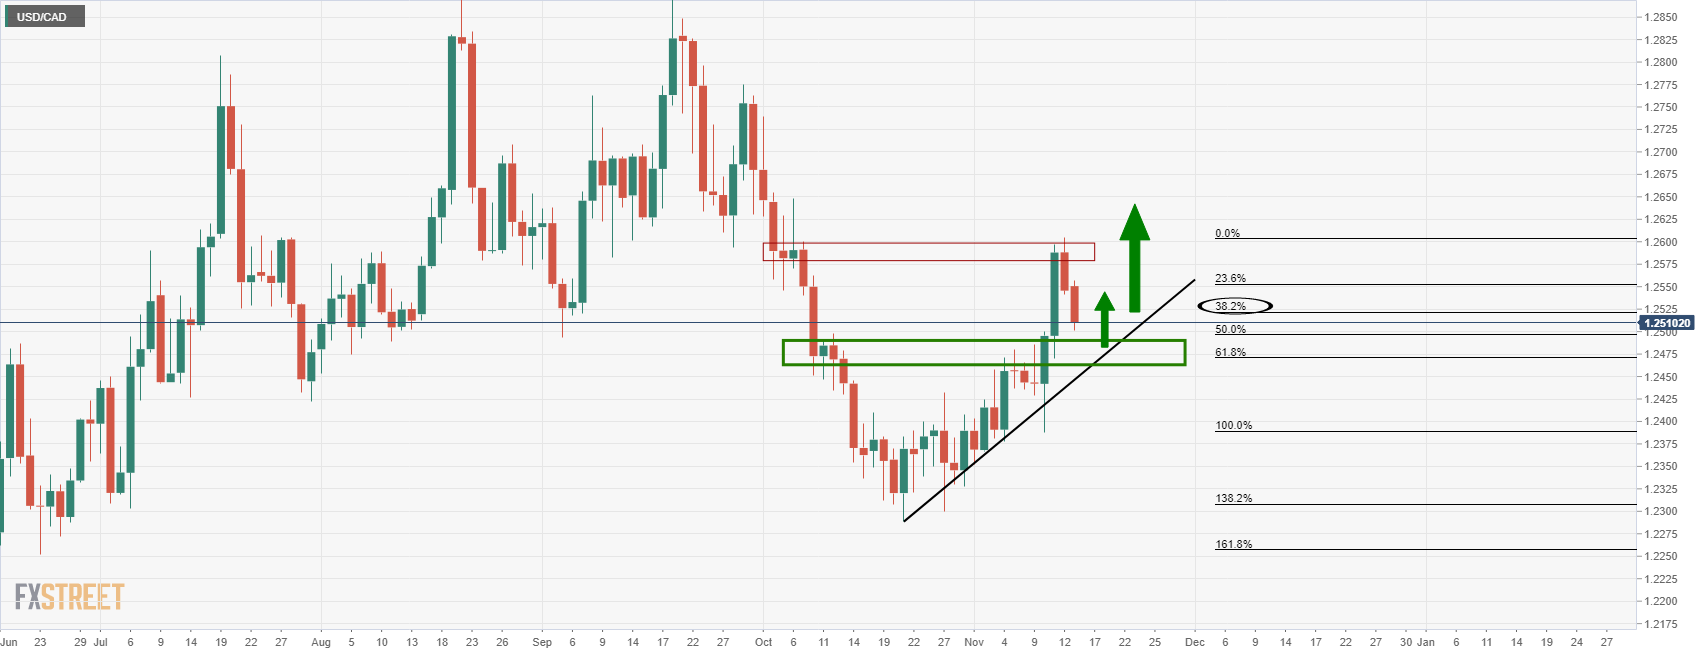
Anywhere between these levels support can be expected to lead to a bullish continuation.
USD/CAD H1 chart
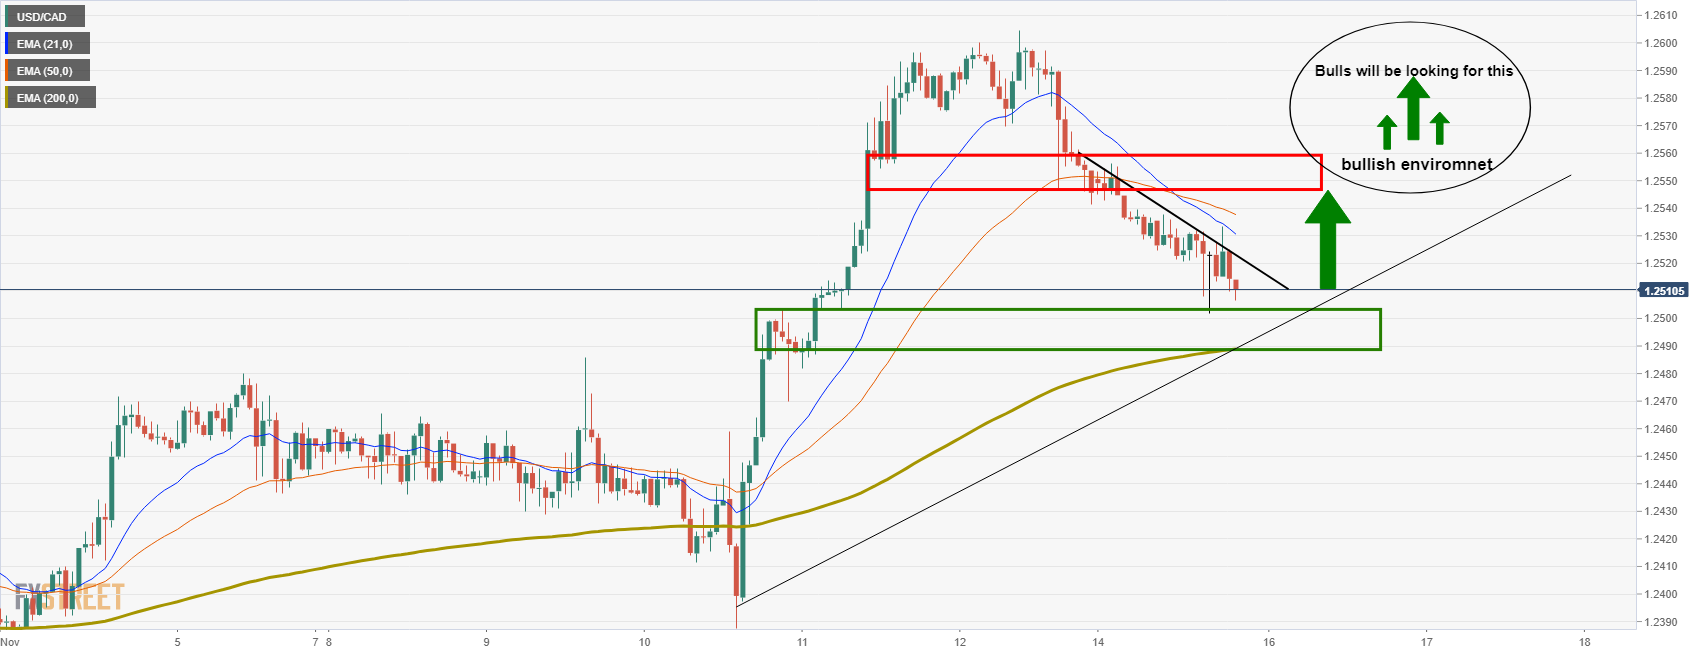
From an hourly perspective, the day has not been favourable to the bullish outlook. The price continued to sink and is now well below the bearish 21 and 50 EMA death cross.
1.2503 is about to come under pressure as being the latest resistance prior to the rally. This could act as support. On a break, then the 1.2480s will be in focus and expected to hold initial tests. So long as the 200-EMA remains intact, then the bias will stay with the daily bullish outlook.
Author

Ross J Burland
FXStreet
Ross J Burland, born in England, UK, is a sportsman at heart. He played Rugby and Judo for his county, Kent and the South East of England Rugby team.


