USD/CAD Price Analysis: Rising wedge keeps sellers hopeful, 1.2700 eyed
- USD/CAD pares intraday losses, stays inside bearish chart pattern.
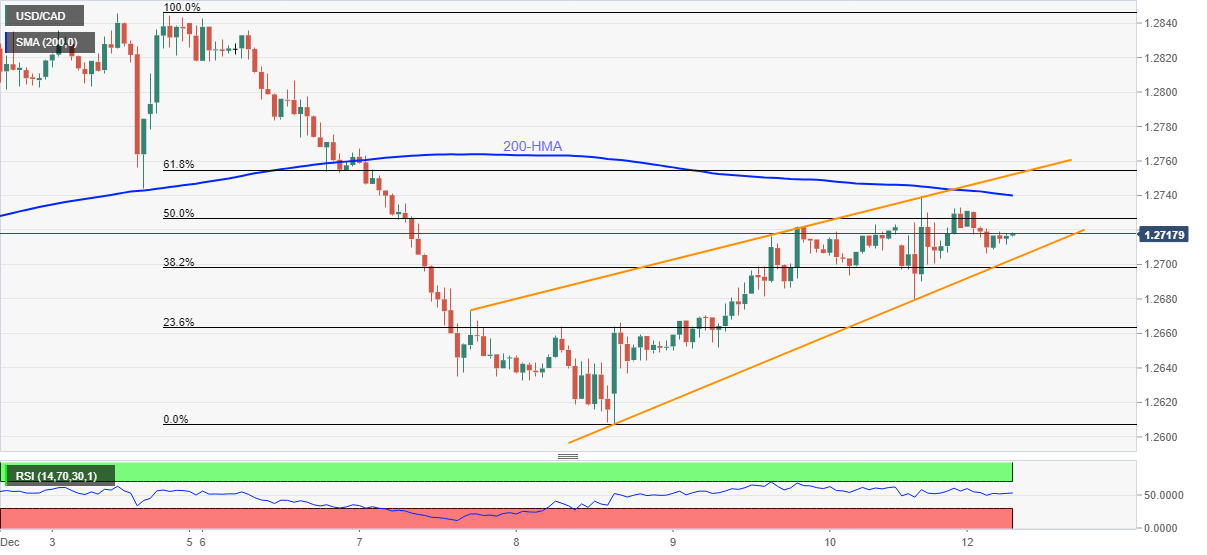
- Sustained trading below 200-HMA, steady RSI also favor sellers.

USD/CAD licks wounds near 1.2715 during early Monday morning in Europe. In doing so, the Loonie pair portrays a rising wedge bearish formation on the one-hour chart.
In addition to the aforementioned one-week-old rising wedge, the quote’s failure to cross the 200-HMA and an absence of extreme RSI conditions keep the sellers hopeful.
However, a clear downside break of the 1.2700 level becomes necessary for the USD/CAD bears to refresh the monthly low surrounding 1.2607 while aiming for the 1.2570 theoretical target.
During the fall, 23.6% Fibonacci retracement level of December 03-08 downside, near 1.2660, may offer an intermediate halt.
Alternatively, 200-HMA and the upper line of the wedge, respectively around 1.2740 and 1.2755, will test the USD/CAD buyers before directing them to the monthly peak surrounding 1.2850.
In a case where the USD/CAD bears keep reins past 1.2570, lows marked during September and late July, near 1.2422 and 1.2495 in that order, will gain the market’s attention.
USD/CAD: Hourly chart
Trend: Pullback expected
Author

Anil Panchal
FXStreet
Anil Panchal has nearly 15 years of experience in tracking financial markets. With a keen interest in macroeconomics, Anil aptly tracks global news/updates and stays well-informed about the global financial moves and their implications.